<return to journal maps or homepage>
Mapping the Chinese Science Citation Database in terms of
aggregated journal-journal citation relations
Journal of the American Society for Information Science & Technology (forthcoming)
![]()
Loet Leydesdorff
University of Amsterdam, Science & Technology Dynamics, Amsterdam School of Communications Research (ASCoR), Kloveniersburgwal 48, 1012 CX Amsterdam, The Netherlands; loet@leydesdorff.net ; http://www.leydesdorff.net
&
Jin Bihui
Library of the Chinese Academy of Sciences, 33 Beisihuan Xilu, Zhongguancun, Beijing 100080, P.R. China; jinbh@mail.las.ac.cn .
Abstract
Methods developed for mapping the journal structure contained in aggregated journal-journal citations in the Science Citation Index are applied to the Chinese Science Citation Database of the Chinese Academy of Sciences. This database covered 991 journals in 2001, of which only 37 had originally English titles and only 31 were covered by the SCI. Using factor-analytical and graph-analytical techniques we show that the journal relations are dually structured. The main structure is the intellectual organization of the journals in journal groups (as in the international SCI), but the university-based journals provide an institutional layer that orients this structure towards practical ends (e.g., agriculture). This mechanism of integration is further distinguished from the role of “general science journals.” The Chinese Science Citation Database thus exhibits the characteristics of “Mode 2” in the production of scientific knowledge more than its western counterparts. The contexts of application lead to correlation among the components.
1. Introduction
Aggregated journal-journal citation relations have been organized in the Journal Citation Reports of the Science Citation Index on a yearly basis. This series has been available electronically since 1994, but the printed version goes back to 1975.[[1]] As early as 1965, on the basis of an experimental version of the Science Citation Index, Derek de Solla Price noted the pronounced structure of this matrix and suggested that it would be possible to decompose it for the mapping of scientific specialties and disciplines (Price, 1965; cf. Simon, 1969). The time series allows us additionally to study the dynamics of the sciences (Leydesdorff, 2002, 2003a).
The dynamics of these aggregated journal-journal citation relations provide us with as a baseline for measuring intellectual development that is relatively independent of intentional (e.g., social or political) agency and intervention (Studer & Chubin, 1982; Zsindely et al., 1982; Leydesdorff, 1987). In principle, this operationalization of the intellectual organization of the sciences in terms relatively independent of the social organization provides explanatory power to the scientometric research program in the sociology of science (Elkana, 1981; Mulkay et al., 1983; Leydesdorff, 1995). In national contexts, however, one can wonder whether more direct couplings between institutional interests and relatively independent journal structures might exist. Perhaps national elites provide an intermediating but invisible college (Crane, 1972; Mulkay, 1976).
For example, the French CNRS subsidizes approximately 225 journals which are only partially covered by the U.S.-based Science Citation Index (De Looze et al., 1996; Legentil, personal communication). There has been continuous debate about how the ISI selects journals for inclusion (Garfield, 1979, 1990; Testa, 1997). Sivertsen (2003) found no bias in the coverage of Scandinavian publications by the Science Citation Index. However, the Institute of Scientific Information (ISI) concedes that the selection system for inclusion in the Science Citation Index may be biased against journals written in non-latin alphabets. Special care has been taken in the past to include Russian and Japanese journals into the database (Garfield, 1979, 1998). Chinese scientific journals, however, have not been systematically evaluated for their inclusion in the ISI database. The expanded version of the SCI at the Internet—the so-called Web of Science—included only 65 Chinese scientific journals in 2001. Although the coverage by ISI has increased rapidly since 1996 (Ren & Rousseau, 2002), Jin et al. (2002) estimated the coverage of the Web of Science in 1999 as 0.73% of the scientific journal titles available in China (Moed, 2002). We estimate that this percentage was approximately doubled in 2001 (1.4%).
The Library of the Chinese Academy of Sciences has developed its own citation database since 1989 (Jin & Wang, 1999), and meanwhile the Institute of Scientific and Technological Information has developed a competing database (Liang & Wu, 2001). In this study we use the Chinese Science Citation Database (CSCD) of the Academy. The data was aggregated in a format similar to the Journal Citation Reports of the SCI for the purpose of this project. We apply graph-analytical and factor analytical techniques that were developed in previous projects for analyzing the international Science Citation Index (Leydesdorff & Cozzens, 1993; Leydesdorff, 2004a), to the Chinese dataset.
2. Methods and materials
2.1 Data
We have examined aggregated journal-journal citation data for 991 Chinese journals. Only 37 of these journals have titles originally in English. The other 954 journal titles were translated into English for the purpose of this communication. In this study we do not distinguish between journals which are published in English and Chinese. Some Chinese journals provide abstracts in English, and vice versa.
Among the 991 journals 55,774 citation relations are maintained, that is, 5.7% of the 982,081 (= 9912) possible relations. The corresponding figure was 2.6% for the Science Citation Index and 2.8% for the Social Science Citation Index in the year 2001. However, these indices exclude most of the single citation relations (using a threshold). Since the single citation relations amount in the CSCD to 28,454, the Chinese figure corrected for this comparison would be 2.8%. We pursue the analysis below including these single occurrences in the Chinese citation matrix.
|
2001 |
CSCD |
SCI |
SoSCI |
|
number of source journals processed |
991 |
5748 |
1682 |
|
source journals not processed ‘citing’ |
0 |
20 |
2 |
|
unique journal-journal relations |
55,774 5.7% |
860,374 2.6% |
80,408 2.8% |
|
sum of journal-journal relations |
223,686 |
15,656,535 |
793,371 |
|
total ‘citing’ |
1,217,554 |
21,613,900 |
2,483,928 |
|
total ‘cited’ |
223,686 |
17,316,281 |
1,170,912 |
Table 1. Comparison of the data in various relevant dimensions for the CSCD 2001 with the SCI 2001 and SoSCI 2001, respectively.
Although more than half the size of the Social Science Citation Index (Table 1), the total number of unique citation relations at the document level is only 223,686 in the Chinese Science Citation Database against 793,371 in the former database. The proportional difference with the Science Citation Index is even larger. This difference can partly be explained by citations in the Chinese journals to the international literature. These citations are not covered by this database.[[2]]
In summary, the matrix representing the CSCD is empty more than the ones representing its international counterparts. Since one can expect the distributions to be heavily skewed—because of Bradford’s law (Drott & Griffith, 1978; Egghe & Rousseau, 1990)—one may expect the matrix to be decomposable to an extent similar to the ISI data (Leydesdorff, 2004a, 2004b).
2.2 Methods
The matrix of 991 x 991 cells was first constructed and then saved as an SPSS systems file. This file can, for example, be factor analyzed. We will use both the overall factor analysis and the routines which we previously developed for the local analysis of journal-journal structures. These latter routines were developed with the systems limitations of a DOS environment (Leydesdorff, 1986), but the restrictions in terms of thresholds—necessary at that time because of memory limitations—are no longer needed. However, these routines enable us to zoom into local structures by choosing an entrance journal for the analysis and then to visualize the relevant environments. Furthermore, Leydesdorff & Cozzens (1993) developed a routine for indicating “central tendency journals” in order to analyze and visualize a local density in the overall matrix systematically in terms of a recursive operation.
In addition to factor analysis we use graph-analytical techniques from social network analysis (Otte & Rousseau, 2002). In particular, bi-connected component analysis has recently been further developed. This technique was originally developed in order to identify robust clusters in large data sets (Knaster & Kuratowski, 1921) and was more recently incorporated in software tools for social network analysis (Moody & White, 2003).
A bi-connected component provides a robust definition of a cluster in a graph because the network component remains connected after removing any one of the vertices (Mrvar & Bagatelj, n.d.). A bi-connected component is defined as a maximally connected subgraph in which for every triple of vertices a, v, and w there exists a chain between v and w which does not include the vertex a. In other words, each node in the bi-connected component is linked to at least two other nodes in this cluster. The bi-connectedness stabilizes the clusters, for example, against changes and variations in the initial selection when producing the database. Thus, the incidental inclusion or exclusion of journals does not directly affect the categorization of the network data.
“Articulation points” or “cut-points” are defined in graph theory as vertices which are shared between two bi-connected components. A node in a graph is an articulation point if removal of this node breaks the graph into more than one bi-connected component (Scott, 1991).[[3]] The program Pajek can be used for the bi-component analysis.[[4]] In addition to providing us with strong visualization techniques for analyzing the bi-components, the program generates a partition indicating the articulation points. This partition can also be extracted and mapped.


Figure 1
Two bi-connected network components with an articulation point
In a previous study Leydesdorff (2004a) analyzed the 5,748 journals of the Science Citation Index 2001 in terms of this algorithm. 3,991 (that is, 73.8%) of the journals were related in a single network at the relatively high level of correlation of r = 0.8 among the citing patterns. In the Social Science Citation Index 2001 the corresponding figure was only 781 or 48.6% of the total of 1608 journals included (Leydesdorff, 2004b). In this latter case, therefore, we increased the value of the Pearson correlation coefficient stepwise from 0.2 with increments of 0.1. An analogous procedure will be pursued in this case because exploration of the data has taught us that some bi-connected components can already be extracted from this dataset at the relatively low level of r = 0.2. (Only 62 journals can be organized in 17 bi-connected components at the high threshold level of r ≥ 0.8.)
More recently, Ahlgren et al. (2003) raised an issue about the use of the Pearson correlation coefficient in author co-citation analysis. They proposed Salton’s cosine as an alternative similarity measure because this measure is not sensitive to the number of zeros (empty cells). These authors’ objections hold a fortiori for our type of matrices. Indeed, when using the cosine matrix, we found differences although mainly at the margins. The Pearson correlation can be considered as a cosine which is normalized for the means.[[5]] In this study, however, we decided to stay with the Pearson correlation in order to keep our results comparable with those of the previous studies using ISI data (Leydesdorff, 2004a and b).
3. Results
3.1 Factor analysis at the system level
The matrix of 991 citing journals was first decomposed using factor analysis. The distribution of the eigenvalues teaches us that the structure is very pronounced (as in the international databases). Nine factors have an eigenvalue which explains more than one percent of the variance and thus more than an average variable. These first nine factors explain 15.47% of the common variance.[[6]]
Extraction of these nine factors provided us with a mixture of positive and negative factor loadings on the last (ninth) factor. By allowing for ten factors, however, the factor analytical solution became unambiguous. Table 2 shows the three journals with highest factor loading for these ten factors. In the last row of this table the eigenvalues and their contribution to explaining the variance are also provided.

Table 2. Ten factors extracted with three highest factor loadings for each.
(Extraction Method: Principal Component Analysis. Rotation Method: Varimax
with Kaiser Normalization; rotation converged in 9 iterations).
These ten factors can be designated in terms of disciplinary affiliations. They also reflect the priorities of the Chinese economy which is still mainly resource-based. The journals loading on the third factor exhibit a local component by being tied to specific medical schools, while the more specialized journals follow with lower factor loadings. For example, the Chinese Journal of Internal Medicine obtains only the 16th position on this list with a factor loading of 0.584. In the Science Citation Index the specialist journals prevail in the biomedical domain.
Furthermore, unlike chemistry (factor 5), mathematics (factor 4), and geology (factor 2), the physics journals do not appear as a separate grouping. Titles of physics journals are subsumed under the various applications of physics such as material sciences (factor 9), advanced optics (factor 10), and computer engineering (factor 6). We shall see below that this focus on the context of application is typical for the organization of these journals.
When the (asymmetrical) matrix is transposed in order to study the Q-structure in the cited dimension, we find essentially the same factors, but the order is different. A ‘pharmacology’ factor replaces one of the previous factors. Table 3 summarizes these results.
|
|
Citing |
Cited |
|
Factor 1 |
Agriculture |
Medicine |
|
Factor 2 |
Geology |
Agriculture |
|
Factor 3 |
Medicine |
Geology |
|
Factor 4 |
Chemistry |
Comput. Eng. |
|
Factor 5 |
Mathematics |
Environ. Sci. |
|
Factor 6 |
Comput. Eng. |
Chemistry |
|
Factor 7 |
Environ. Sci. |
Mat Sci Tech |
|
Factor 8 |
Oceanology |
Mathematics |
|
Factor 9 |
Mat Sci Tech |
Pharmacy |
|
Factor 10 |
Optoelectronics |
Oceanology |
Table 3. Factor structure of the ten first factors in the citing and the
cited dimension of the matrix.
In our opinion, the different order among the factors mainly reflects differences in citing behaviour among the various disciplines. For example, a medical paper has a higher chance of being cited than a mathematical one, but a paper in medicine may on average draw more easily on papers in other disciplines than a paper in agriculture or geology. In general, however, the structure of the database in the cited dimension corresponds with the one in the citing dimension. This indicates a system reproducing the intellectual organization of the database on a yearly base (Leydesdorff, 1995).
In summary, we found a disciplinary structure in the citation structures of the Chinese Science Citation Database, both in the cited and the citing dimensions. Institutional structures related to specific universities are visible in citation patterns among journals in the medical sciences. This suggests that in the publication and citation patterns, the clinical side of the health care system prevails over the research side of the disciplinary organization. Similarly in physics, we noted the dominance of the applied side. Otherwise, the intellectual codification structures the differentiation among the journals into sets. In the next section, we investigate the 10+ disciplines distinguished above in more detail by using a graph-analytical approach.
3.2 Bi-connected components
The matrix can be decomposed into 70 bi-connected components. These components vary in terms of the internal strength of the citation relations. For example, the largest group is composed of a set of 54 journals in medicine which relate at the level of (Pearson’s) r ≥ 0.4. This bi-component is visualized in Figure 2. The other factors mentioned in Table 2 equally provide bi-connected components with a number of journals included. However, one can also find similar components which do not belong to these central groupings. (Maps and listings of the bi-components in this dataset can be retrieved at http://www.leydesdorff.net/china01 ).

Figure 2. Bi-connected component of 54 journals in medicine that relate at the level r ≥ 0.4
Figure 2 confirms the suggestion about the degree of specialization in medical journals contained in this set. Separate groupings of oncology and pathology journals are visible, but the core group is organized in terms of general and clinical medicine. Note that this component cannot be found when using the Science Citation Index for this analysis because journals belonging to the various medical specialties prevail in the citation patterns in this database (Leydesdorff, 2004a; see for the corresponding maps at http://www.leydesdorff.net/jcr01 ).
Figures 3 and 4 show that the (first) factor of agriculture is internally composed of different subgroupings which do not relate to each other in terms of the bi-connected graph analysis. Figure 3 shows that 12 agricultural journals with stand at the top of the list of factor loadings in the first factor at the system level, form a single bi-component at the threshold level of r ≥ 0.6. However, Figure 4 provides a visualization of a larger group of 29 journals in botany which are internally related at this same level of correlation.
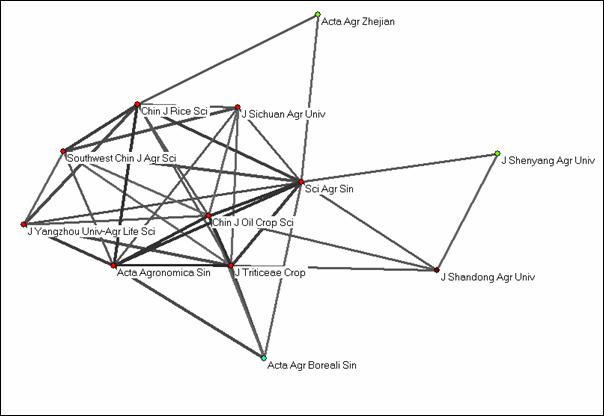
Figure 3. Twelve agricultural journals related into a bi-connected component at r ≥ 0.6.
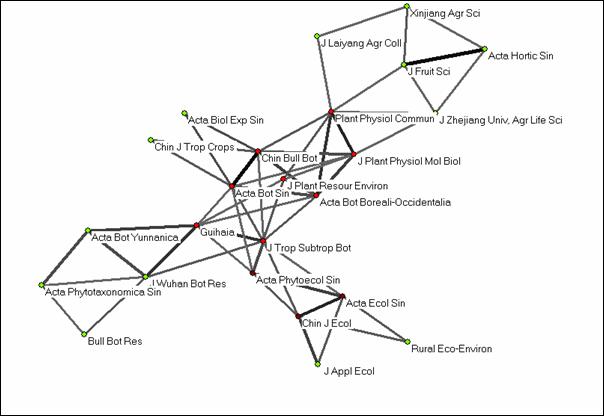
Figure 4. Twenty-four botany journals related into a bi-connected component at r ≥ 0.6
Similar differentiations into fine-grained disciplinary structures of specialties can be distinguished in the other major dimensions of the matrix as well. The bi-connected components are comparable with those in the Science Citation Index and the Social Science Citation Index, but the Pearson correlations are on average lower within the clusters. In the next section, we use factor analysis at this lower level of aggregation for the more detailed analysis of these specialties.
3.3 Factor analysis at the specialty level
Table 4 shows the (default) factor structure using the journal Scientia Agricultura Sinica as the seed journal for the generation of a local citation environment. This journal was the one with the highest factor loading on the first factor at the system level. The factor was designated above as representing “agricultural sciences.”
Table 4. Factor structure among citing patterns of 27 journals in the
citation environment of Sci Agr Sin (with a threshold at 1% of total
cited or total citing of the seed journal).
The component matrix shows that the 27 journals which are citing or cited by this seed journal at more than one percent of its total citation rate in 2001 are organized in eight dimensions (with eigenvalues ≥ 1). The first grouping represents “agricultural sciences,” the second one “botany,” and a third one “horticulture.” Smaller groupings are also distinguished. These are sometimes strongly related to regional centers at specific universities.
Most remarkable about this matrix is the considerable filling of “off-diagonal” cells. Although the highest factor loading on the main dimensions are at levels of approximately 0.8, the interfactorial complexity cannot be neglected. This is only seldom the case in this type of analysis when using data from the (Social) Science Citation Index (Leydesdorff & Cozzens, 1993; Van den Besselaar & Heimeriks, 2001). It indicates that the various dimensions of the intellectual organization (which prevails) are also organized in another dimension, notably the institutional one of regional and national universities.
Although the second factor in Table 4 (with highest factor loading for the Chinese Bulletin of Botany) indicates a group of botany journals, the intellectual organization of botany is not well represented from this (agricultural) perspective on the journal structure. The journal Acta Botanica Sinica, for example, which is also included in the international Science Citation Index, does not play a significant role in this citation environment. If we approach the journal structure from this latter angle using Acta Botanica Sinica as a seed journal, however, we loose the major agricultural journals (Table 5). Thus, the divide between the intellectual organization (botany) and the applied-science side (agriculture) can be considerable. We had to use a horticultural journal (Acta Horticulturae Sinica) as a point of entry for bringing the two fields into a single perspective (Figure 5).
Table 5. 20 journals in the citation environment of Acta Botanica Sinica
|
|
||
|
A. J Fujian Agr Forest B. Guangdong Agr Sci C. Guihaia D. J Fruit Sci E. J Hunan Agr Univ F. J Huazhong Agr Univ G. J Laiyang Agr Coll H. J Lanzhou Univ I. Liaoning Agr Sci J. Chin J Trop Crops K. J Shandong Agr Univ |
L. J Shenyang Agr Univ M. Ecol Sci N. Food Sci O. J Northwest Sci Tech P. Acta Bot Boreali‑ Q. J Southwest Agr Univ R. Southwest Chin J Agr S. Xinjiang Agr Sci |
U. J Yunnan Agr Univ V. J Zhejiang Univ, Agr W. J Zhejiang Forest Coll X. Zhejiang Forest S&T Y. J Plant Physiol Mol Z. Plant Physiol Commun a. Acta Bot Sin b. Chin Bull Bot c. Sci Agr Sin |
Figure 6 provides a factor plot of the two main factors (“agriculture” and “botany”) when analyzed from the perspective of “horticulture” (i.e., using Acta Horticulturae Sinica as the seed journal). The figure shows that the journals are not only positioned along the main axes of the system, but that the interfactorial complexity provides some journals with mediating roles. These journals are often associated with specific universities.
Figure 6. Factor plot of two main components in the citation environment of Acta Horticulturae Sinica.
We checked whether the interfactorial complexity was a consequence of the inclusions of cell values to the lowest level of a single occurrence in the Chinese database by recoding all ones into zeros. Although the resulting solutions, of course, are slightly different, this operation did not affect the rotated component matrices systematically.
3.4 Multidisciplinary journals
Like general science journals in the international journal set (e.g., Nature), the Chinese Science Bulletin (科学通报; Kexue Tongbao) plays a role different from specialty journals (Ren & Rousseau, 2004). For example, in the factor analysis of the citation environment of Acta Botanica Sinica (Table 5 above) this journal is visible as an isolate with a major factor loading on the fifth factor. A similar relevance in the citation environments of different disciplines can be found for the general science journals in the international literature. By focusing on the citation of the Chinese Science Bulletin itself, however, we will be able to explain in more detail the differences between the graph-analytical approach of bi-component analysis and the factor analysis.
Rotated Component Matrix(a)
|
|
Component |
||||
| 1 |
2 |
3 |
4 |
5 |
|
|
Adv Earth Sci |
.816 |
.262 |
.260 |
|
|
|
Quatern Sci |
.812 |
.211 |
|
|
|
|
Sci Chin D |
.787 |
.208 |
|
.116 |
|
|
Acta Sediment Sin |
.542 |
|
|
.116 |
|
|
Earth Sci Front |
.362 |
-.138 |
.320 |
.343 |
|
|
Sci Chin C |
.177 |
.808 |
|
|
.432 |
|
Chin Sci Bull |
.529 |
.777 |
.235 |
.107 |
.157 |
|
Prog Natural Sci |
.334 |
.773 |
.237 |
|
.200 |
|
Chin J Magn Res |
|
.689 |
|
|
-.218 |
|
Sci Chin B |
.291 |
.640 |
|
|
-.108 |
|
Acta Petrol Sin |
|
.100 |
.922 |
.212 |
|
|
Acta Petrol Mineral |
|
|
.921 |
.233 |
|
|
Bull Miner, Petrol Geochem |
.586 |
.225 |
.609 |
.420 |
|
|
Geochim |
.443 |
.276 |
.558 |
.212 |
|
|
Acta Geol Sin |
.140 |
|
.247 |
.931 |
|
|
Geol Rev |
|
|
.250 |
.922 |
|
|
Acta Bot Sin |
-.201 |
.192 |
-.229 |
|
.819 |
|
Acta Phys Sin |
-.308 |
.263 |
-.306 |
|
-.531 |
Extraction Method: Principal Component Analysis.
Rotation Method: Varimax with Kaiser Normalization.
a Rotation converged in 7 iterations.
Table 6. Factor structure among citing patterns of 18 journals in the citation environment of the Chinese Science Bulletin (with a threshold of 1% of total cited or total citing of the seed journal).
The factor loading of the Chinese Science Bulletin are boldfaced in Table 6. This journal has considerable factor loading on each of the factors in its environment. The first factor consists of eight journals that all belong to the bi-component of 33 geology journals that is exhibited in Figure 7. Three “general science” journals, however, are visible as a subgraph which is encircled in this figure.

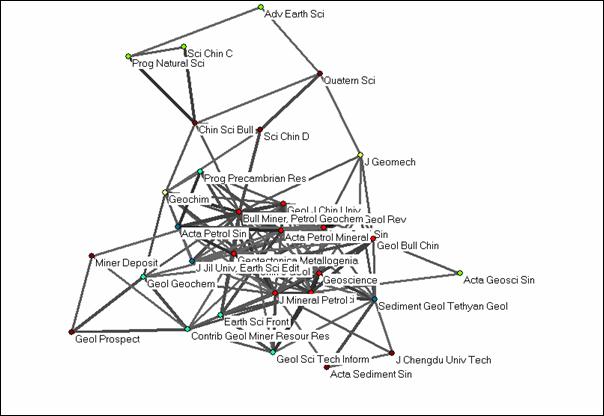
Figure 7. Thirty-three geology journals related into a bi-component at r ≥ 0.6.
None of the “general science” journals provides an articulation point of the graph because after removing the Chinese Science Bulletin the graph would remain bi-connected through the citation patterns of Quaternary Sciences. However, the Chinese Science Bulletin is not exclusively a member of this grouping, but this is not visible using bi-component analysis in this top-down mode.[[7]] The factor analysis reveals the factorial complexity of the general science journals and this can then be illustrated by visualizing the relations among these journals in terms of the similarities of their citation patterns (Figure 8). The representation shows also Acta Botanica Sinica and Acta Physica Sinica as two other leading journals in the database. These leading journals form a thinly populated next-order network on top of the disciplinary organization of the citation relations.
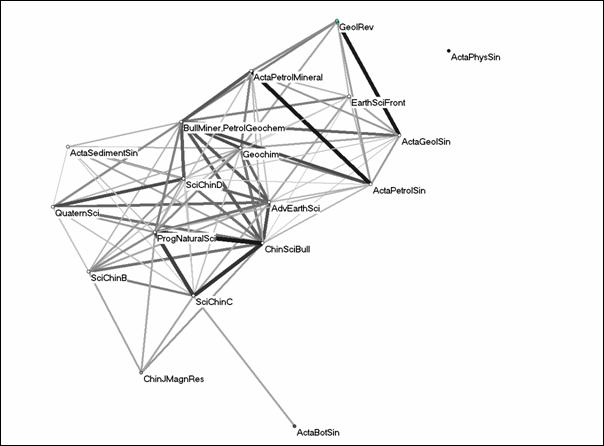
Figure 8. Eighteen “general science” and geology journals related at r ≥ 0.2.
4. Conclusions
While the Science Citation Index and the Social Science Citation Index exhibit the prevailing differentiation among journal groupings in terms of specialties and disciplines, the Chinese Science Citation Database is additionally integrated by a maze of university-based journals. The latter are sometimes also specialized, for example, in the medical field. The main organization of these university-based journals, however, is not determined by their intellectual or institutional affiliations, but by the context of application of these journals. In general, these journals have lower impact factors than the nation-wide journals.
We elaborated this tension between differentiation and integration in the case of the relation between journals in botany and agriculture above, but the pattern was also indicated in medicine and in physics. The layer of university-based journals generates inter-factorial complexity among the otherwise intellectually organized dimensions of the citations in the journal set. In a next study, we intend to test this hypothesis by using oblique rotation in the factor analysis when comparing journals in the overlap between the Chinese Science Citation Database and the Science Citation Index.
This mechanism of integration in institutional terms was further distinguished from the mechanism of integration provided by “general science journals.” The latter provide a mechanism of integration on top of the journal structures by functioning as a relevant citation environment in a variety of specialty structures. These journals are usually based in a leading dimension of the database like in the Chinese case the geo-sciences. In the international literature, the bio-sciences provide the main location for general science journals like Science, Nature, and PNAS. The “general science journals” provide a next-order network, while the university-based journals provide a lower-level mechanism of integration.
In summary, one could say that the Chinese Science Citation Database exhibits the characteristics of “Mode 2” in the production of scientific knowledge more than its western counterparts (Gibbons et al., 1994). In addition to intellectual organization a layer of institutional integration provides a focus on the priorities of the economy and the state that is absent in the international database.
<return to journal maps or homepage>
Acknowledgement
The authors wish to thank Zhang Wang for his help with organizing the data.
References
Ahlgren, P., B. Jarneving, & R. Rousseau. (2003). Requirement for a Cocitation Similarity Measure, with Special Reference to Pearson's Correlation Coefficient. Journal of the American Society for Information Science and Technology, 54(6), 550-560.
Bensman, S. J. (2004). Pearson's R and Author Cocitation Analysis: A Commentary on the Controversy. Journal of the American Society for Information Science and Technology, 55(10), 935-936.
Carpenter, M. P., & Narin, F. (1973). Clustering of Scientific Journals. Journal of the American Society of Information Science, 24, 425-436.
Cozzens, S. E., & Leydesdorff, L. (1993). Journal Systems as Macro-Indicators of Structural Change in the Sciences. In: A. F. J. Van Raan, R. E. de Bruin, H. F. Moed, A. J. Nederhof & R. W. J. Tijssen (Eds.), Science and Technology in a Policy Context (pp. 219-233) Leiden: DSWO Press/Leiden University.
Crane, D. (1972). Invisible Colleges. Chicago: University of Chicago Press.
De Looze, M.-A., Cronini, R., Legentil, M., Jeannin, P. & Magri, M.-H. (1996). Determining the Core of Journals of a Research Centre: The Example of Researchers from the Department of Rural Economy and Sociology of the Institut National de la Recherche Agronomique, France, Scientometrics 36(2), 167-183.
Drott, M. C., & Griffith, B. C. (1978). An Empirical Examination of Bradford's Law and the Scattering of Scientific Literature. Journal of the American Society for Information Science, 29(5), 238-246.
Egghe, L., & Rousseau, R. (1990). Introduction to Informetrics. Amsterdam: Elsevier.
Elkana, Y., Lederberg, J., Merton, R. K., Thackray, A. & Zuckerman, H. (1978). Toward a Metric of Science: The Advent of Science Indicators. New York, etc.: Wiley.
Garfield, E. (1979). Citation Indexing. New York: Wiley.
Garfield, E. (1990). How ISI selects Journals for Coverage: Quantitative and Qualitative Considerations, Current Contents (28 May 1990) 5-13.
Garfield, E. (1998). Journal Impacts as Surrogates. Paper presented at the 41st Annual Meeting of the Council of Biology Editors, Salt Lake City, UT; at http://www.garfield.library.upenn.edu/papers/eval_of_science_CBE(Utah).html
Gibbons, M., Limoges, C., Nowotny, H., Schwartzman, S., Scott, P., & Trow, M. (1994). The New Production of Knowledge: The Dynamics of Science and Research in Contemporary Societies. London: Sage.
Gilbert, G. N. & Mulkay, M. J. (1984). Opening Pandora’s Box: A Sociological Analysis of Scientists’ Discourse. Cambridge: Cambridge University Press.
Jin, B., Jiangong, Z., Chen, D., & Zhu, X. (2002). Development of Chinese Scientometric Indicators. Scientometrics, 54 (1), 145-154.
Jin, B., & Wang, B. (1999). Chinese Science Citation Database: Its Construction and Application. Scientometrics, 45 (2), 325-332.
Knaster, B. & Kuratowski, C. (1921). Sur les ensembles connexes. Fund. Math. 2, 206-255.
Leydesdorff, L. (1986). The Development of Frames of Reference, Scientometrics, 9, 103-125.
Leydesdorff, L. (1987). Various Methods for the Mapping of Science. Scientometrics, 11, 291-320.
Leydesdorff, L. (1995). The Challenge of Scientometrics: The development, measurement, and self-organization of scientific communications. Leiden: DSWO Press/Leiden University; at http://www.upublish.com/books/leydesdorff-sci.htm .
Leydesdorff, L. (2002). Dynamic and Evolutionary Updates of Classificatory Schemes in Scientific Journal Structures. Journal of the American Society for Information Science and Technology, 53 (12), 987-994.
Leydesdorff, L. (2003a). Can Networks of Journal-Journal Citations Be Used as Indicators of Change in the Social Sciences? Journal of Documentation, 59 (1), 84-104.
Leydesdorff, L. (2003b). The Construction and Globalization of the Knowledge Base in Inter-Human Communication Systems. Canadian Journal of Communication, 28(3), 267-289.
Leydesdorff, L. (2004a). Clusters and Maps of Science Journals Based on Bi-Connected Graphs in the Journal Citation Reports, Journal of Documentation (forthcoming).
Leydesdorff, L. (2004b). Top-Down Decomposition of the Journal Citation Report of the Social Science Citation Index: Graph- and Factor-Analytical Approaches. Scientometrics (forthcoming).
Leydesdorff, L. (forthcoming). Similarity Measures, Author Cocitation Analysis, and Information Theory. Journal of the American Society for Information Science and Technology.
Liang, L., & Wu, Y. (2001). Selection of Databases, Indicators and Models for Evaluating Academic Performance of Chinese Universities. Research Evaluation, 10 (2), 105-113.
Moed, H. F. (2002). Measuring China’s research performance using the Science Citation Index, Scientometrics, 53(3), 281-296.
Moody, J. & White, D. R. (2003). Structural Cohesion and Embeddedness: A Hierarchical Concept of Social Groups. American Sociological Review 68(1), 103-127.
Mrvar, A., & Bagatelj, V. (n.d.). Network Analysis Using Pajek; at http://vlado.fmf.uni-lj.si/pub/networks/pajek/doc/pajekman.htm. Retrieved December 5, 2003.
Mulkay, M. J. (1976). The Mediating Role of the Scientific Elite, Social Studies of Science, 6 445-470.
Mulkay, M., Potter, J., & Yearley, S. (1983). Why an Analysis of Scientific Discourse Is Needed. In K. D. Knorr & M. J. Mulkay (Eds.), Science Observed: Perspectives on the Social Study of Science (pp. 171-204.). London: Sage.
Otte, E. & Rousseau, R. (2002). Social Network Analysis: A Powerful Strategy, also for the Information Sciences. Journal of Information Science 28(6), 443-455.
Pinch, T. J. (1982). Kuhn—the Conservative and Radical Interpretations. Are Some Mertonians ‘Kuhnians’ and Some ‘Kuhnians’ Mertonians? Society for the Social Studies of Science (Newsletter), 7 (10-25).
Popper, K. R. ([1935] 1959). The Logic of Scientific Discovery. London: Hutchinson.
Ren, S., & R. Rousseau. (2002). International Visibility of Chinese Scientific Journals. Scientometrics, 53(3), 389-405.
Ren, S., & R. Rousseau. (2004). The Role of China’s English-Language Scientific Journals in Scientific Communication. Learned Publishing, 17(2), 99-104.
Simon, H. A. (1969). The Sciences of the Artificial. Cambridge, MA/London: MIT Press.
Sivertsen, G. (2003). Bibliografiske Datakilder til Dokumentasjon av Vitenskapelige Publikasjoner. Oslo: NIFU skriftserie nr. 22/2003; at http://www.nifu.no/publikasjoner/rapporter/skriftserie22-2004.pdf .
Testa, J. (1997). The ISI Database: The Journal Selection Process. Online available at http://www.isinet.com/isi/hot/essays/199701.htm.
Van den Besselaar, P. & Heimeriks, G. (2001). Disciplinary, Multidisciplinary, Interdisciplinary: Concepts and Indicators. In M. Davis and C.S. Wilson (Eds.), Proceedings of the 8th International Conference on Scientometrics and Informetrics - ISSI2001. Sydney: UNSW; pp. 705-716.
White, H. D. (2003). Author Cocitation Analysis and Pearson's R. Journal of the American Society for Information Science and Technology, 54(13), 1250-1259.
Whitley, R. D. (1984). The Intellectual and Social Organization of the Sciences. Oxford: Oxford University Press.
Zsindely, S., Schubert, A., & Braun, T. (1982). Editorial Gate-keeping Patterns in International Science Journals – A New Science Indicator. Scientometrics, 4 (1), 57-68.
<return to journal maps or homepage>