The Journal of Communication and the Field of Communication Studies:
Mapping Scientific Communication Online
Loet Leydesdorff
Amsterdam School of Communications Research (ASCoR), University of Amsterdam
Kloveniersburgwal 48, 1012 CX Amsterdam, The Netherlands;
loet@leydesdorff.net; http://www.leydesdorff.net
&
Han Woo Park,
YeungNam University, South Korea
hanpark@ynu.ac.kr; http://www.hanpark.net
Abstract
In this study, the authors have three objectives:
1. To make aggregated journal-journal citation networks based on the Journal Citation Reports 2004 of the Science Citation Index (5968 journals) and the Social Science Citation Index (1712 journals) accessible online from the perspective of any of these journals. The results are available at http://www.leydesdorff.net/jcr04 as input-files for the visualization program Pajek. The user is thus able to analyze the citation environment of a scientific journal, for example, in terms of core groups and peripheries.
2. To study the journal structure of communication studies as a discipline using the Journal of Communication as an example. Communication studies can be considered as a single field from the perspective of “being cited,” but it is divided into two communities who reconstruct the field differently by making references.
3. To replace the notion of a global impact factor with that of a local impact factor relative to a journal’s citation environment. The local impact of a journal in its citation environment can be defined as its share of the total citations in this environments. The vertical size of the nodes is varied proportionally to this citation impact; the horizontal axis of each node will be used to provide the same information after correction for within-journal (self‑)citations.
Keywords: scientific communication, journal, impact, citation, vector-space, visualization, Pajek, map
1. Introduction
Derek de Solla Price (1963) noted that publishing papers as a means of communicating scientific findings is and always has been a means of anticipating or settling priority conflicts by claim-staking. As Price argued, these claims can be vital to the scientist and his or her institution in order to secure prestige (Bunz, 2005) . For these reasons, “scientists have a strong urge to write papers but only a relatively mild one to read them” (ibid., p. 68). Given the number of papers published each year, it would be hard to say that researchers spend significant amounts of time reading each other’s papers. How then to assess the quality of a new contribution to the field? Can the journal impact factor be used as a proxy for the quality of a scientific paper?
The use of the impact factors of journals has become common practice in research evaluation (Moed, 2005), but several problems have not been resolved, such as:
1. Impact factors are averages, while the underlying distributions are skewed: most papers are never cited, and only a few become highly cited. The underlying distributions are probably generated by negative power laws (Katz, 2000);
2. Impact factors are based on citation windows of two years while quality may be indicated only in the longer run. This time horizon varies also among fields of science (Price, 1970; Nederhof et al., 1989);
3. Impact factors vary among fields of science and even specialties within some fields with almost an order of magnitude (Garfield, 1979; Leydesdorff, 1986; Pudovkin & Garfield, 2002).
A fix to the variation among disciplines has been suggested by Hirst (1978) who proposed “discipline impact factors.” More recently, Bensman (2001 and forthcoming; cf. Bensman & Wilder, 1998) showed that more than with the impact factor faculty usage and appreciation of journals correlates with the total citations given to a journal. Citations can be considered as a measure of a journal’s prestige, while the impact factor of the ISI follows the development of the field at the frontiers of research. However, systematic differences in citation behaviour among fields of science can be expected to affect both impact factors and total citations. For example, citation practices may differ significantly between authors in communication studies and the information sciences (Rice, 1990; Borgman & Rice, 1992; Leydesdorff, 2004b).
The alternative of a more finely-grained measure of impact like a local impact factor, presumes either the possibility of a robust classification of the journals (Pinski & Narin, 1976) or it has to be based on another unit of analysis, e.g., the individual paper. Relations among individual papers can be mapped using co-citation or co-word analysis (Callon, 1986; Chen, 2003; Small, 1999). The maps enable us to follow historical developments within fields of science, but the identification of these communication structures in terms of their disciplinary organization cannot be provided by these maps (Rip, 1997). The yardsticks of their intellectual position remain the journals and their disciplinary structures (Leydesdorff, 1987).
Can a robust way be found to delineate the scientific journals in terms of specialties and disciplines? The ISI-staff assigns journals to subjects on the basis of a number of criteria, among which are the journal’s title, its citation patterns, etc. (McVeigh, personal communication, 9 March 2006). After a long series of attempts to develop a methodology based on aggregated citations (Rice et al., 1989; Leydesdorff, 2002, 2003, 2004a, 2004b; Leydesdorff & Cozzens, 1993), we have come to the conclusion that this has been an impossible project for both theoretical and empirical reasons.
Empirically, the top-down decomposition and the bottom-up agglomeration can be distinguished. The top-down decomposition has become possible recently since one is able to load the entire citation matrix into memory. Leydesdorff (2006a) showed that in order to provide meaningful results, the decomposition has to entail assumptions, for example, about the number of dimensions to be distinguished in the model.
The bottom-up aggregation remains very sensitive to the point(s) of entrance and other parameter choices because the multi-dimensionality of the journal space may bring together in a latent dimension what seems far apart in the dimensions under study. The problem finds its origin in the fuzziness of the sets: different sets are partial subsets of one another (Bradford, 1934; Garfield, 1979; Pudovkin & Garfield, 2002; Leydesdorff & Bensman, 2006). A model necessarily reduces this complexity by focusing on one or some sets at the detriment of others. Interdisciplinary links between and among sets can be crucial for further developments in networks (Granovetter, 1973; Leydesdorff, 2006b).
The aggregated journal-journal citations provided by the Journal Citation Reports of the (Social) Science Citation Index can be considered as a huge matrix of cited and citing journals, respectively. The matrix is asymmetrical and overwhelmingly empty. Scientific journals tend to cite one another in dense clusters which represent specialties. However, some (e.g. interdisciplinary) journals cite and are cited across different fields (Narin et al., 1972). This is well-known of Science and Nature at the top of the hierarchy, but there are also hierarchies spanning fields at lower levels (Doreian 1986; Doreian & Fararo, 1985). For example, the journals of American professional associations may function as elite institutions across cognitive delineations among specialties (Bensman, 1996; Lauf, 2005). While the majority of the journals remain embedded in one or more specialized publication and citation structures, the matrix thus is nearly decomposable (Simon, 1973).
Consequently, the decomposition remains sensitive to the choices of the various parameters involved, such as the seed journal(s) for collecting a citation environment, the threshold levels, similarity criteria, and the clustering algorithm. In other words, the vectors of the journal distribution span a multi-dimensional space in which clouds can be distinguished, but the delineation of these clouds at the edges remains fuzzy (Bensman, 2001) and varies with the perspectives chosen by the analyst (Leydesdorff & Cozzens, 1993; McKain, 1991). Particularly, if one wishes to construct a baseline against which to measure change, the distinctions among variations, measurement errors, auto-correlations in the data, and structural change may become too uncertain to be meaningful (Leydesdorff, 1991, 2002).
While in previous mappings the search focused mainly on a parsimonious representation among the many possible ones (e.g., by using rotation of the main dimensions as in factor analysis), the possibility to provide journal maps online using visualization techniques from social network analysis has changed the situation dramatically (Otte & Rousseau, 2002). If it is deemed no longer feasible to provide an objectified representation at the cluster level, one might leave the choice of the entrance journal, the choice of the clustering, and therewith the perspective to the end-user. Furthermore, users may wish to inspect the relevant citation environments in both the cited and citing dimensions as two different perspectives on a journal’s position. Tijssen et al. (1997) combined these two perspectives into a single representation using quasi-correspondence analysis, but there are also substantive reasons to distinguish between “cited” as impact and “citing” as behaviour (Rice et al., 1988). Zhou & Leydesdorff (2005), for example, found that leading journals in China sometimes cite exclusively from the international literature, but are cited mainly by other journals at the national level. Thus, cited and citing aggregates can inform us also about hierarchies among journals.
2. Methods
All journals of the Journal Citation Report 2004 were mapped in terms of the cosines among the vectors of the journals in the environments of each seed journal. This was done for both the Science Citation Index (5968 journals) and the Social Science Citation Index (1712 journals). The relevant environment for each subsequent journal was determined by including all journals which cite or are cited by the journal under study to the extent of one percent of its citation rate in the respective dimension (He & Pao, 1986; Leydesdorff, 1986). This generates sets on the order of 10-50 journals. For each set, a citation (transaction) matrix can be composed. Note that the citation environments were delineated differently in the cited and the citing dimensions.
The matrices were normalized using the cosine as the similarity measure (Salton & McGill, 1983). The cosine is equivalent to the Pearson correlation coefficient (Jones & Furnas, 1987), but its non-parametric character has advantages in the case of sparse matrices (Ahlgren et al., 2003). For the purpose of the visualization, it is convenient that the cosine provides us with positive values only, while one expects also negative values in a Pearson correlation matrix. While the Pearson correlation coefficient remains the statistical instrument for finding the eigenvectors of the network or for inferential statistics (Bensman, 2004), the cosine seems an appropriate measure for mapping the vector-space (Almind & Ingwersen, 1997).
For each journal two files were generated and brought online at http://www.leydesdorff.net/jcr04 : one in the “cited” and another in the “citing” direction. The (ASCII) text files with the cosine values can be read directly into Pajek. Pajek is a visualization program for social network analysis which is freely available for non-commercial usage at http://vlado.fmf.uni-lj.si/pub/networks/pajek . Cosine values below 0.2 were suppressed in order to enhance the interpretability of the visualizations. Within Pajek the user can choose a variable width for the lines in the network and colours or grey shades for nodes and links, respectively. The nodes can also be partitioned (and coloured) in accordance with their allocation into clusters using the various graph-analytical tools available within the program. Files can be exported in various formats for further processing in SPSS, and programs like UCINET and NetDraw.
As a refinement, the percentage of contributions to the citations—citing or cited, respectively—can be used to determine the size of each node. By distinguishing between the vertical size of a node and the horizontal one, a second parameter can be used to indicate the correction for within-journal (self‑)citations (Price, 1981; Noma, 1982). Thus, by inspecting the shape of the ellipses one is able to see how much a journal is dependent on an inner circle of authors citing one another. Note that within-journal citations can be both self-citations of authors and citations among authors publishing in the same journal.
In summary, all journals citing or being cited by the seed journal will be drawn into the local citation environment, respectively, but the tail of the distributions from the seed journal’s perspective is discarded for delineating the environment. Thereafter, all values above one are used for the citation matrix (because the ISI suppresses single relations by summing them under the category “All others”). The grandsum of the consequent citation matrix N (= ∑cij) is used as the basis for the normalization of the citation contributions. Each journal contributes with its margin total ni (= ∑ci) as a percentage of the grandsum. The value of the main diagonal element (cii) will be used as a correction factor.
3. Materials
The data was harvested from the CD-Rom versions of the Journal Citation Reports 2004. The bottom values for “All others” combined were discarded, and the other data organized in a relational database management system so that citation matrices can be extracted from any chosen perspective. In principle, these perspectives can be based on choosing either a seed journal or a list of relevant journals, but the analysis in this study is limited to individual journals. A dedicated program was written to provide the citation matrices as input files for SPSS, UCINET, and Pajek. The focus is here on the Pajek files because these are the ones brought online.
Table 1 provides descriptive statistics for the two databases (Science Citation Index and Social Science Citation Index).
Table 1: Descriptive statistics of the Journal Citation Reports 2004 of the Science Citation Index and the Social Science Citation Index, respectively.
|
Item |
SCI 2004 |
SoSCI 2004 |
|
Number of source journals processed |
5968 |
1712 |
|
Source journals not processed ‘citing’ |
192 |
40 |
|
1,038,268 3.01% |
96,207 3.36% |
|
|
Sum of journal-journal relations |
18,943,827 |
966,619 |
|
Average cell value |
18.25 |
10.05 |
|
Total ‘citing’ |
25,798,965 |
2,909,219 |
|
Total ‘cited’ |
20,909,401 |
1,453,397 |
|
Within-journal citations’ |
2,016,500 |
137,269 |
Note that the within-journal citations are on the order of 10% across the files, but one can expect that these percentages vary among journals and specialties. The overall density of the network is more than twice as high in the sciences when compared with the social sciences in terms of the average cell values. However, both matrices are extremely sparse: we added to the row with unique journal-journal relations the percentage of cells with a value as compared with the total number of possible relations. This percentage is a bit higher for the social sciences because the networks are more spread.
Because of the copyright issues potentially involved in using this data, only the normalized matrices of cosines and not the data matrices were brought online. In previous studies (Leydesdorff, 2004a and 2004b), the visualizations were made available online. However, the input files enable users to apply their own visualization techniques in a more flexible way.
4. Results
The paper discusses the data, using the position of the Journal of Communication as an example to explain the options provided by this methodology. The choice for the Journal of Communication is convenient because this journal’s environment informs us thoroughly about the structure of relations in this field (Lauf, 2005). In a previous study—using 2001-data—Leydesdorff (2004b, at pp. 174 ff.) used Communication Research as the seed journal and found two bi-connected components in the citing patterns of journals in communication studies: “political communication” and “inter-human communication.” Journals in either component cited journals in the other grouping to a significantly lower degree. The Journal of Communication, however, was the one with highest factor loadings on both dimensions.
As we shall see below, the Journal of Communication is part of a bi-connected (and therefore strong) graph among eight communication studies journals in the citing dimension (Table 2). However, important journals which can be classified as belonging to communication studies are not part of this set.
Table 2: Eight communication journals which form a strong graph in the citing dimension with their respective impact factors and total times cited in 2004.
|
Journal name |
Impact factor 2004 |
Total times cited in 2004 |
|
Communication Monographs |
1.214 |
576 |
|
Communication Research |
1.018 |
895 |
|
Communication Theory |
1.263 |
250 |
|
Human Communications Research |
1.526 |
834 |
|
Journal of Applied Communication Research |
0.517 |
115 |
|
Journal of Communication |
1.213 |
1161 |
|
Journalism and Mass Communication |
0.511 |
348 |
|
Public Opinion Quarterly |
1.000 |
1625 |
Table 2 shows that the Journal of Communication has the second place among these journals in terms of total times cited behind Public Opinion Quarterly. As will become clear below, this latter journal does not belong to the “being-cited” environment of these communication studies journals, but it belongs to another discipline.
4.1 Being-cited patterns of the Journal of Communication
The Journal of Communication was cited in 2004 to a total of 1,161 times. Among the many hundred journals which cited this journal, sixteen cited it above the threshold level of twelve times (1%) and 159 journals cited it only once. Thus, the distribution is highly skewed.
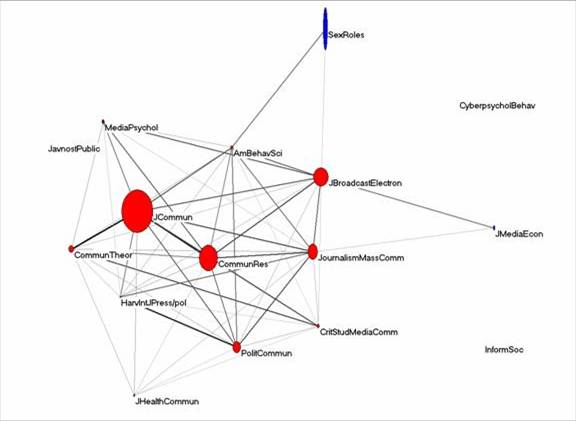
Figure 1: Mapping of the citation environment of Journal of Communication (2004) in the cited dimension using Pajek (cosine ≥ 0.2; threshold 1%).
Figure 1 provides the citation environment of the Journal of Communication 2004 in the cited dimension. The journal is strongly embedded in a core group of nine communication studies journals, while Media Psychology and the Journal of Health Communication are also embedded in this group, but do not belong to the core set. Sex Roles and the Journal of Media Economics are related, but connected to the central graph at specific sites and only indirectly to the Journal of Communication itself. Three more journals (Cyberpsychology & Behavior, Information Society, and Javnost-The Public, a Slovenian journal) are relevant in the citation environment, but the citation patterns of these journals are so different that the cosine is smaller than 0.2 in all the relations. In other words, these journals span other dimensions of the relevant citation environment.
The use of the data definition language of Pajek enables us to add more parameters. We use this option for storing quantitative information about citation contributions of the respective journals. Table 3 provides the text file which corresponds to Figure 1 as an example. (This file can be retrieved at http://www.leydesdorff.net/jcr04s/cited/v812.txt.)
Table 3: Input file for the representation of the citation environment of the Journal of Communication 2004
The sixteen journals in this citation environment are first defined as vertices with a label. Thereafter, three parameters are available for the coordinates of the nodes in the x, y, and z-direction (which will not be used in this study). The two parameters “x_fact” and “y_fact” provide a value for the magnification of the node in the two main directions. (Other parameters can be added, for example, in order to change the shape of the nodes from circles and ellipses into triangles, boxes or diamonds.) One should be aware that the information contained in these parameters is lost if the Pajek-files are subsequently exported into the DL-format, for example, for the purpose of further processing in programs like NetDraw or UCINETf.
In this design, the two parameters are used for indicating the percentage contribution to the thus selected citation environment both including and excluding within-journal citations. For example, the Journal of Communication was cited within this environment—that is, by these sixteen journals—528 times of which 146 were within-journal citations. The total number of citations in the citation matrix among these sixteen journals—the grandsum (N = ∑cij)—was 2,468 and thus, the percentage of the citations obtained by the Journal of Communication within this environment is (528/2,468) * 100 = 21.39%. This percentage is conveniently used as the value of the parameter “y_fact.” After correction for within-journal citations, the percentage becomes ((528-146)/2,468) * 100 = 15.48%. This value is analogously used for the parameter “x_fact.” (The relevant line with these values is boldfaced in Table 3.) Thus, the ASCII file provides both the inputs needed for drawing the picture in Pajek and the numerical information about these percentages for those users who are interested quantitatively in the local impact factors of journals in specific citation environments.
The local impact factors are expressed as percentage shares of the grandsum of the citation environment, since the use of percentages makes the sizes independent of the citation characteristics of the specialties under study. Note that the within-journal citation rate in any year is a constant for each journal. However, the weight of this constant in each environment (N = ∑cij) and in the total number of citations of the journal (∑ci) varies with the environment and thus with the choice of the seed journal. In other words, the shapes and sizes of the nodes are environment-dependent.
4.2 Citing patterns
While being-cited patterns can be considered as impact which is largely beyond the control of the authors who are cited, citing patterns are produced by the collective of authors publishing in a certain journal in the year under study. These patterns therefore reveal how this community perceives and reconstructs its relevant environments at the time. Again, this perception can meaningfully be distinguished in terms of within-journal (“self-”)citations and citations of other journals. The two pictures of cited and citing are coupled by the within-journal citations because this number is the same in both directions.
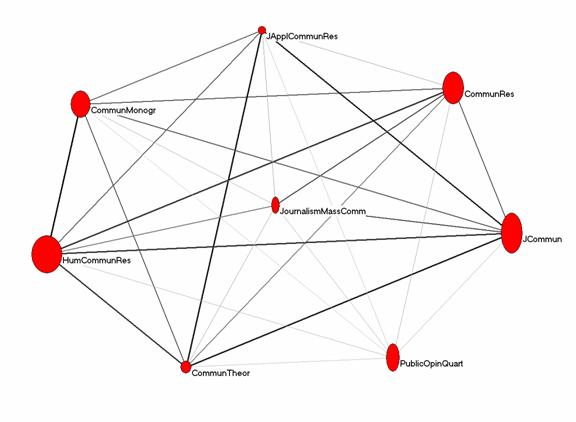
Figure 2: Citing patterns of the Journal of Communication 2004 (cosine ≥ 0.2; threshold: 1%).
Articles in the Journal of Communication cited to a total of 2,199 times during 2004. Since the threshold of one percent thus applies to all journals cited more than twenty-one times, the tail of the distribution is much larger than in the cited dimension. The journal reaches out to a broader literature, but the core in the citing dimension is at the same time more focused than in the being-cited dimension. Only seven other journals are cited by the aggregate of authors in this journal above the threshold of one percent. These journals form a strong core group (which cannot be subdivided by the k-core algorithm available in Pajek). The more vertical shapes of the ellipses show that the (fixed) number of self-citations weights more heavily in this citation environment since the grandsum of the matrix is now only 1,544 (as against 2,468 in the previous matrix).
In summary, both in the cited and in the citing dimension we found a strongly inter-connected core set of journals as the ego-network of the Journal of Communication. The central journals of the field like Communications Research, the Journal of Communication, Communication Theory, Journalism and Mass Communication are part of both networks. These journals can be considered as part of the field’s archive and authors within them actively reconstruct the field. Three more journals (Human Communications Research, the Journal of Applied Communication Research, and Public Opinion Research) share a pattern of citing with these journals, but are not cited to the same extent. In the latter dimension, a number of other journals (e.g., the Journal of Broadcasting and Electronic Media) can be considered as central parts of the citation impact environment of the Journal of Communication.
4.3 The complete citation environments (cited and citing)
The data allows us to take a broader look at the position of the specialties within communication studies in its context by reducing the initial threshold to zero. Thus, we consider all journals which cite or are cited by the Journal of Communication during 2004. The journal is cited in 121 journals more than once, and it is making references in its pages to 107 journals. (As noted, the ISI suppresses single relations by summing them under the category “All others”.)
Figure 3 provides the complete citation impact environment of the Journal of Communication including 106 of the 121 journals which relate to each other with a cosine ≥ 0.2. (Without a threshold, all edges of the graph would exist and the visualization would no longer be informative about the clustering structure.)
Figure 3: Citation impact environment of the Journal of Communication in 2004. Hundred-six journals are connected at a level of cosine ≥ 0.2.
Although journals of social and experimental psychology are prevailing in this set, the group of communication-studies journals is the most coherent group in terms of its being cited patterns. Factor analysis (using four factors which explain only 16.0% of the variance in the matrix) enables us to distinguish a group of 24 journals as loading on the first factor (Table 4). The Journal of Communication itself has the highest loading on this factor (0.874) and can thus be considered as a best representation of this group (Leydesdorff & Cozzens, 1993).
Table 4: Four-factor solution of “being-cited” patterns of 121 journals citing the Journal of Communication during 2004.
Rotated Component Matrix(a)
|
|
Component |
|||
|
|
Communication studies |
2 |
3 |
4 |
|
J Commun |
.874 |
.222 |
-.025 |
-.018 |
|
Commun Res |
.742 |
.227 |
-.102 |
-.088 |
|
Commun Theor |
.741 |
.243 |
-.075 |
.008 |
|
Journalism Mass Comm |
.688 |
.093 |
-.020 |
-.007 |
|
Hum Commun Res |
.687 |
.360 |
-.113 |
-.068 |
|
Polit Commun |
.643 |
.028 |
-.012 |
.027 |
|
Commun Monogr |
.616 |
.381 |
-.109 |
-.034 |
|
Crit Stud Media Comm |
.567 |
.079 |
-.018 |
.009 |
|
J Broadcast Electron |
.565 |
.103 |
.085 |
-.119 |
|
Harv Int J Press/Pol |
.545 |
-.070 |
.002 |
-.008 |
|
Int J Public Opin R |
.485 |
.108 |
-.062 |
-.026 |
|
Eur J Commun |
.466 |
-.176 |
.045 |
-.073 |
|
Media Psychol |
.431 |
.074 |
-.024 |
-.086 |
|
Media Cult Soc |
.419 |
-.116 |
.018 |
-.031 |
|
Res Lang Soc Interac |
.362 |
.177 |
-.037 |
.086 |
|
J Health Commun |
.327 |
.051 |
-.012 |
.061 |
|
New Media Soc |
.309 |
-.079 |
.010 |
-.045 |
|
Q J Speech |
.264 |
.043 |
-.042 |
-.013 |
|
Discourse Soc |
.261 |
.157 |
-.136 |
.066 |
|
J Media Econ |
.170 |
-.077 |
.021 |
-.044 |
|
Health Commun |
.168 |
.078 |
.029 |
.051 |
|
Annu Rev Polit Sci |
.123 |
7.52E-005 |
-.031 |
.020 |
|
Educ Stud |
.104 |
-.020 |
-.005 |
-.002 |
|
Public Relat Rev |
.080 |
-.040 |
-.019 |
-.020 |
|
J Environ Psychol |
-.079 |
.079 |
-.050 |
-.009 |
|
J Sport Manage |
-.050 |
.001 |
-.031 |
-.041 |
|
J Aging Stud |
-.047 |
-.007 |
-.001 |
.047 |
|
Annu Rev Psychol |
-.289 |
.706 |
.078 |
-.164 |
|
J Appl Soc Psychol |
-.191 |
.623 |
-.159 |
-.050 |
|
Pers Soc Psychol Rev |
-.224 |
.596 |
-.048 |
-.114 |
|
… |
-.057 |
.555 |
.104 |
.000 |
Extraction
Method: Principal Component Analysis.
Rotation Method: Varimax with Kaiser Normalization.
a Rotation converged in 7 iterations.
This picture of a coherent set changes when analyzing the set from the other perspective of “citing” (Rice et al., 1988). A four-factor solution now explains 40.6% of the variance and shows how the communication-studies journals are divided in terms of disciplinary affiliations (Table 5). Figure 4 visualizes this for the 106 journals which are connected among them above the threshold of cosine ≥ 0.2. The major divide is among psychology-oriented journals and journals which are oriented towards the political sciences. A second divide between journals which focus on health and youth issues versus sociological journals can also be distinguished.
Figure 4: Citing patterns of 106 journals cited by authors in the Journal of Communication during 2004 (cosine ≥ 0.2).
Table 5: Four factor solution for the citing patterns 107 journals which were cited by authors in the Journal of Communication during 2004.
Rotated Component Matrix(a)
|
|
Component |
|||
|
|
Psychology & Human communication |
Sociology |
Management & Human Relations |
Political Science and Communication |
|
Psychol Bull |
.935 |
|
|
|
|
Annu Rev Psychol |
.924 |
|
|
.105 |
|
J Pers Soc Psychol |
.921 |
|
.141 |
.116 |
|
Pers Soc Psychol B |
.905 |
|
.151 |
.123 |
|
Adv Exp Soc Psychol |
.895 |
|
.149 |
.128 |
|
Soc Cognition |
.892 |
|
.129 |
.100 |
|
J Exp Soc Psychol |
.891 |
|
.162 |
.130 |
|
J Appl Soc Psychol |
.885 |
|
.229 |
|
|
J Psychol |
.833 |
|
.122 |
|
|
Organ Behav Hum Dec |
.718 |
|
.311 |
|
|
J Soc Issues |
.701 |
.158 |
|
|
|
Small Gr Res |
.676 |
.296 |
.433 |
|
|
Hum Commun Res |
.667 |
-.103 |
.242 |
.297 |
|
…. |
…. |
|
|
|
|
Annu Rev Sociol |
|
.956 |
|
|
|
Am Sociol Rev |
|
.945 |
|
|
|
Soc Forces |
|
.941 |
|
|
|
Sociol Quart |
|
.932 |
|
|
|
Am J Sociol |
|
.928 |
.103 |
|
|
Soc Probl |
|
.927 |
|
|
|
Sociol Inq |
|
.917 |
.112 |
|
|
… |
|
|
|
|
|
J Manage |
.142 |
|
.866 |
|
|
Acad Manage J |
|
.257 |
.852 |
|
|
Group Organ Manage |
.218 |
|
.826 |
-.115 |
|
J Organ Behav |
.196 |
|
.825 |
-.119 |
|
Acad Manage Rev |
.344 |
.155 |
.823 |
|
|
Acad Manage Exec |
|
|
.814 |
-.124 |
|
Organ Sci |
|
.243 |
.805 |
|
|
Hum Relat |
||||