
Loet Leydesdorff
Science & Technology Dynamics
Nieuwe Achtergracht 166, 1018 WV Amsterdam
The Netherlands
<loet@leydesdorff.net> ; http://www.leydesdorff.net/
Using percentage performance shares of individual member states, the European Union can be assessed as if it were a network publication system. The prediction of systemness (based on the Markov property of the distribution) can be tested against the predictions of trend lines for individual nations. The publication performance of the EU can also be compared to that of the U.S.A. and Japan. The results suggest that a comparison with (global) world trade is important for understanding developments between the various R&D systems. Predictions for the 1999 indicator values are also provided.
1. Introduction
Hitherto, scientometric indicators have been assessed mainly as time series data by using descriptive statistics. Using information theory, however, these time series can be compared with (static) predictions on the basis of the assumption of systemness in a set of indicators. In a previous study, these alternative hypotheses were tested against each other for the case of the twelve member states of the European Community at that time (Leydesdorff 1992 and 1995). We analyzed publication data in terms of the aggregate, in terms of different document types (that is, articles, reviews, notes, and letters), and for international coauthorship relations within each of these categories.
Was a single European system emerging in any of these dimensions? The answer at that time (early 90s) was negative, although the subset of coauthored research articles tended to exhibit systemness at the European level (in some years). In this study, I repeat this analysis for the fifteen member states of the European Union. However, I focus on national performance data using articles, reviews, and letters, and then also compare the EU with the U.S.A. and Japan as the main competitive systems (cf. Van Raan 1998). (See for a recent study of internaitonal coauthorship relations at the EU level, Glänzel et al. 1999.)
The data was collected (from scratch) in February 1999 by using the Dialog installation of the Science Citation Index. This on-line version of the SCI has now been reorganized so that one can conveniently compile sets on the basis of the country name for the corporate source (e.g., Ingwersen 1999). Since the data type "notes" has been dropped from the on-line version of the database since 1996, data collection was limited to research articles, reviews,(1) and letters (cf. Braun et al. 1989). I will compare the results for this aggregate with an analysis in the dimension of "articles" only.
The research question is whether the EU can increasingly be considered as a single publication system or whether, alternatively, the individual member states provide a better prediction for next year's indicator values. The two hypotheses are again tested against each other in terms of the better prediction for the next year. Additionally, we are able to test the development of the distribution among the fifteen member states for path-dependency. As the system property is further developed, path-dependency of the distribution can increasingly be expected.
2. Methods and data
As noted, the data was down-loaded from the on-line version of the Science Citation Index at Dialog. With this system, tape years can be delineated by using the accession numbers. This delineation corresponds precisely to the organization of the ISI-data on the CD-ROMs for the various years. German data were searched for both the fields "Germany" (from 1992 onwards) and the "Federal Republic of Germany" (before 1992). Additionally, data for the "German Democratic Republic" were obtained for the period 1974-1991.
Data for the U.K. are based on using an OR-statement on a search for data with an English, Scottish, Welsh or Northern Irish address (cf. Andersen et al. 1988). Similarly, EU (15 member states) and EC (12 member states) data are constructed by using an OR-statement on data for individual member states. The OR-statement corrects for internationally coauthored articles in the combined set (cf. Ingwersen & Christensen 1997).
In one analysis --the one for path-dependency-- "Luxembourg" will not be included, since various categories are sometimes empty and its world share of publications is on the order of 0.01% percent only. In general, a nominal zero in a category was always replaced with a one in order to prevent an uncontrolled division by zero in the computational analysis. (2)
I noted in a previous publication that the data for the period 1974-1977 was rather disorganized on the occasion of an update in the early 1980s, so that the present search results can no longer be compared with data collected in the late 1970s (Leydesdorff 1988, at p. 152, n. 12). This study therefore uses data from 1980 onwards. This data provides us with a time series of almost twenty years. The data for 1998 is based on an estimate at the time of the data collection (February 1999).
For the prediction based on each time series from year m to year n, it can be shown (Leydesdorff 1995; cf. Theil 1966) that the best prediction for the year (n + 1) is expected to be:
Given the historical dimension of the process of European unification, and based on inspection of the data, I chose to use a ten-year time window for the prediction. However, each prediction will be based on the best fit using the ten preceding years providing us with ten different predictions. The best prediction is then the one with the lowest expected information content, since an expected information content I = 0 can be associated with an event that is already fully expected (or, in other words, provides no surprise-value at all).
The set of individual predictions for the fifteen member states of the European Union can be compared with the assumption that a given previous year will contain the best prediction of the current year. (This is also called the Markov property.) In terms of the matrix these two predictions stand orthogonally: for example, if the years are organized as consecutive fields, that is horizontally as rows, the distribution of each year is organized vertically in the column dimension.
The two forecasts can be compared with the actual values in terms of bits of information, and the best one is again the one with the lowest value for I. This dynamic measure of the probabilistic entropy I, can be defined as:
I = Sigmai qi2log(q i / pi)
In words: I is the expected information content of the message that the prior probability distribution Sigmaipi has been replaced by the posterior one Sigmaiqi (Theil 1972; cf. Shannon 1948). If the two-base is used for the logarithm, the expected information is expressed in binary units of information or bits.
Additionally, a measure of path-dependency can be constructed based on the possibility that a revision of a prediction in an in-between year improves the prediction to such an extent that the signal sent by the previous year is boosted by the revision (as in the case of an auxiliary transmitter). After such an event, the history of the system has become irrelevant for its further development. While the above comparison assessed whether the history of the individual elements of the system provides a basis for further prediction, this assessment evaluates the dependency of the system's property on contextual contingencies. To which extent has closure of the system's operation been achieved? The perspective of "path-dependency" relates our study to the question of the self-organization of the European information society. However, a large literature surrounds this controversial subject (e.g., Liebowitz and Margolis, 1995; Foray 1998).

Our definition of "path-dependency" is empirical and can be operationalized in terms of information theory (cf. Frenken & Leydesdorff, forthcoming). Take the triangle depicted in Figure 1. If the two sides of the triangle AB and BC offer a shorter route for the signal to travel than the direct transmission AC, contrary to the geometry of the figure, the improvement of the prediction at B can be considered as critical to the further development of the signal.
On the basis of Shannon's mathematical theory of communication, this state of affairs can be assessed by using the following formula:
IA|B + IC|B < IC|A (3)
Thus, a critical revision is the case if:
(IC|A - IA|B - IC|B ) > 0 (4)
Using formula (2) above, one can evaluate this measure of path-dependency in terms of bits of information.
In summary: if the in-between event B disturbs the series, then external information is added to the pathway and the system can no longer be considered as closed in terms of its operation along a trajectory. A closed system is path-dependent. Closure of the system is a necessary condition for self-organization, but self-organization additionally implies that a system be able to reproduce its own boundaries (cf. Maturana & Varela 1980; Fujigaki 1998; Scharnhorst 1998).
3. Descriptive statistics
Figure 2 exhibits publication performance in terms of percentage of world share of publications, for the European Union in comparison with the U.S.A. and Japan during the period 1980-1998. The European system is indicated for both the European Union of the fifteen current member states (EU) and the European Community of twelve member states. The latter group will be indicated henceforth as the Europan Community (EC) for the sole purpose of distinguishing it from the EU.
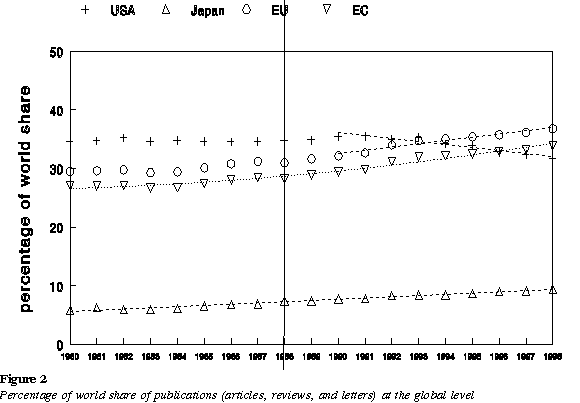
The figure exhibits, among other things, the relative decline of the U.S. publication system and the advance of the other two major systems. The second polynominal is used for the curve fitting in the case of the EC set in order to highlight how the line potentially deviates from a linear trend (r > 0.98): the relative changes of the 1980s seem to be enhanced during the 1990s. Since 1990, the U.S.A. has lost 0.51% per year in terms of its world share of publications (r > 0.95), while the EU has gained 0.56% per year (r > 0.97).
If the data type is limited to "articles," these values are 0.52 and 0.57, respectively. Otherwise the patterns are almost identical. In other words, the other two data types (letters and reviews) diminish the pronounced growth and decline rates exhibited by research articles (cf. Leydesdorff 1992).
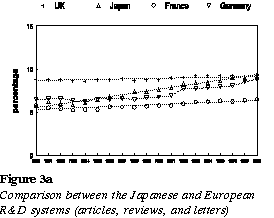
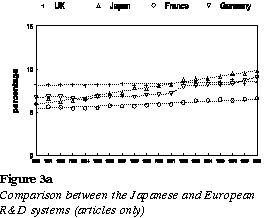
Figure 3 compares the continuously linear increase of the Japanese percentage of world share of publications with comparable European countries, that is, the U.K., Germany, and France, both in terms of the aggregate of data types (Figure 3a) and in terms of research articles only ( Figure 3b). While the U.K. and France are approximately stable, Japan and Germany exhibit spectacular increases. The German increase is largely due to the unification of Germany that is reflected in the data in 1992. Japan, however, exhibits a steady increase in world share of publications of 0.208 % per year (r > 0.99).(3) Both Japan and Germany nowadays outperform the U.K. in terms of their percentage of world share of research articles.
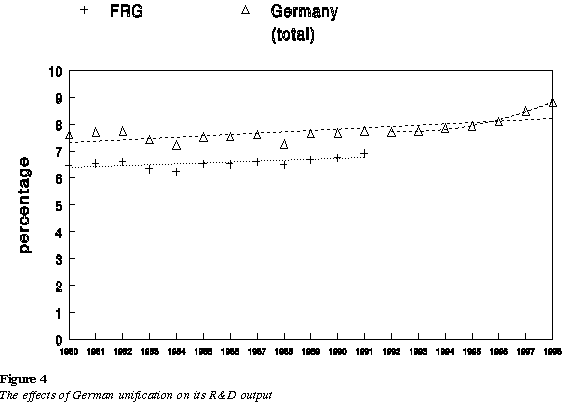
As noted, Germany is a special case because of its recent unification. Figure 4 provides a detailed picture of the German case. The difference between the two lines between 1980 and 1991 indicates the contribution of the German Democratic Republic. The trend after unification seems to indicate a pattern of increasing growth. A linear curve fits only at r = 0.72, but a second order polynomial fits with r > 0.99 for these seven data points.
4. The European decomposition
The overall increase of the share of the European Union during this period (Figure 2) was not caused by the R&D systems of the relatively large shares of the UK and France (Figure 3). As we can see from Figures 5 and 6, European nations differ considerably in their participation in this increase. The most spectacular growth rates are exhibited by the Italian and Spanish data. As visible from Figure 5, this increase is even gaining momentum. During the 1990s, Italy and Spain have grown with 0.14% yearly (r > 0.95).
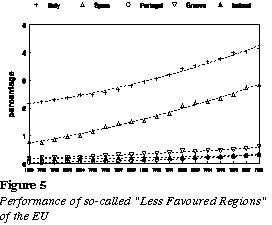
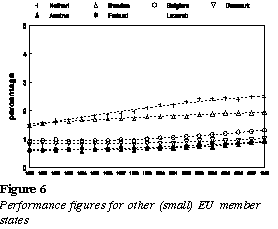
Among the smaller countries collected in Figure 6 (that is, the ones which cannot be counted as so-called "less favoured regions" in Europe) some are also increasing their world share of publications, while others like the Netherlands and Sweden have recently witnessed a flattening of their rates of increase. Data for the Netherlands exhibited very stable growth during the 1980s ( = 0.063; r > 0.99), but this growth is now reduced to almost half its previous rate ( = 0.034; r > 0.95). However, none of the other EU countries exhibit a growth rate at the 0.1 percent level during the 1990s.
5. Testing for "systemness"
Figure 7 provides a graphic representation of the statistics of the test for systemness in both the EU data and the data for comparison at the global level between the EU, the U.S.A., and Japan. Since the average value of this measure is very close to zero both for the EU and for the global comparison, this data shows mainly randomness, in my opinion. In other words, the prediction on the basis of the Markov assumption is not improved when compared with the assumption of independent trajectories for the nation states. However, the alternative hypothesis is also not strongly corroborated. Moreover, this picture is not significantly affected by focusing on "articles" only.
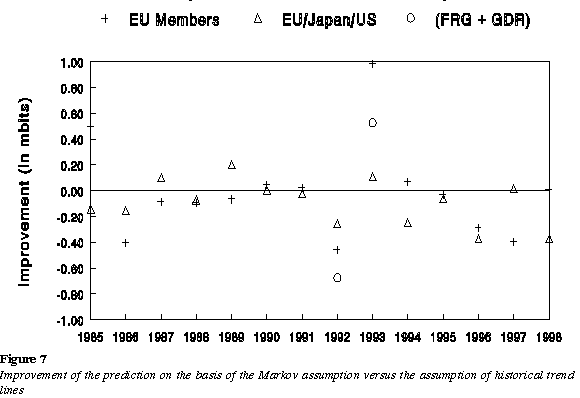
The outlayers for the EU data are partly due to the German unification process. If this event is taken into account (that is, by using the total German data set instead of that of the FRG), the extreme effects in 1993 are mitigated, but they do not disappear in 1992. In other words, the EU publication system was not severely upset by German unification because it was never a system in the first place.
In summary, these results suggest that in terms of publications, the EU does not yet exhibit systemness. (In a comparable study, Leydesdorff & Oomes (1999) found systemness for the case of the EU monetary system. I return to the comparison across function systems in a later section.) However, the alternative hypothesis of trajectories for individual member states is also not corroborated by these results. The situation seems rather indecisive. Furthermore, there is no sign of an increase in systemness over time. The systemness hypothesis is rejected in most of the years both in the case of the distribution of EU member states and in the comparison of the EU data with those of the U.S.A. and Japan.(4)
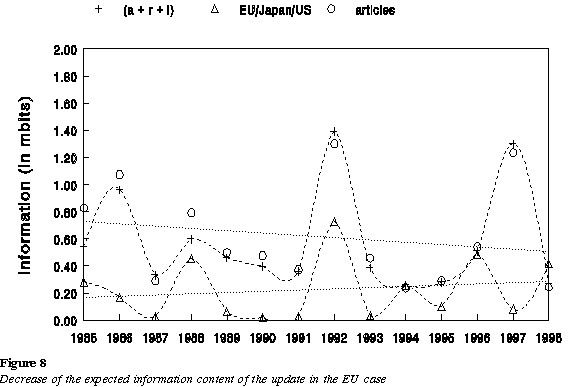
Multivariate prediction (based on the assumption of the Markov property) can itself also be considered as a measure of systemness. Figure 8 shows the trendlines for a comparison of the EU-countries, a global comparison, and thirdly the limitation to articles only. The graphs cannot be compared in terms of absolute values (since the number of categories and therefore the maximum entropy is different at the two levels of comparison), but the slope in the EU case is negative, while it is slightly positive in the case of the global comparison. This can be considered as a weak indicator of increasing systemness in the EU data set (since the Markov property would mean that I = 0). The correlation between the fluctuations in the curves suggests a coupling between the global and the EU "system."
6. "Path-dependency" in the EU data set
Independently of the question of whether the EU can better be considered as a system or as a collection of nation states, one can raise the question of whether the distribution at the EU level follows (increasingly?) a trajectory over time. As noted, this can be tested by using the measure of path-dependency developed above.
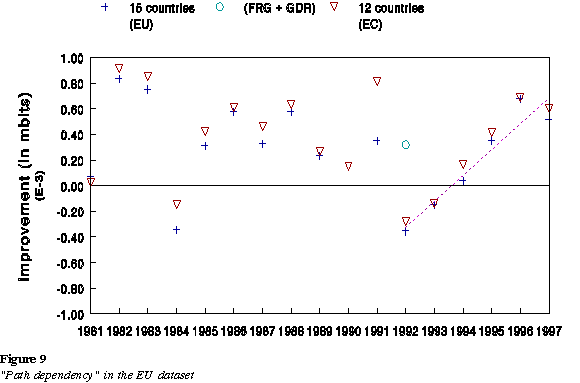
Figure 9 exhibits the results of this test. Path-dependency is rejected only in 1984 and in 1993. In 1992, the unification of Germany disturbs the data, as indicated in the figure. After the establishment of the EU in 1991 (Maastricht Treaty), path-dependency in the data is further enhanced. The other disturbance (in 1984) may be caused either by a reorganization of the database or by events occurring in the represented systems. We are not able to distinguish between these possible causes from this perspective. (A focus on "articles only" as data type provides a similar picture. Note that the extension of the data with Austria, Finland and Sweden has a negative but not significant impact on this test of systemness.)
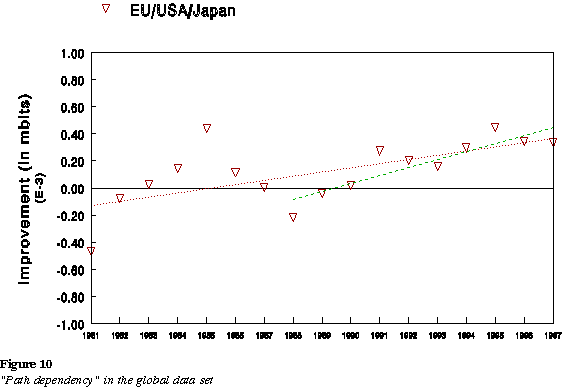
In Figure 10 the data is analyzed at the global level. This system (of the EU, U.S.A., and Japan) seems increasingly to develop along a trajectory, especially during the 1990s. Perhaps this can be considered as an indicator of the regime of knowledge-intensive economies that has emerged since the collapse of the Soviet system.
7. Conclusions
As noted, Leydesdorff & Oomes (1999) have studied the emergence of a single European Monetary System. Both in terms of real economic exchange rates and in terms of nominal convergence, a single European system could increasingly be indicated by using the measures of systemness explained above. In the case of the publication system, however, the main conclusion from this study seems to be that R&D is internationally integrated, for example, with the American and Japanese R&D-systems.
Since our conclusion was in this case against the hypothesis of systemness, we were able to make a choice in favour of the forecasts on the basis of trend lines for each unit separately. Table 1 provides the corresponding forecasts for 1999 values of percentages of world share on this basis (using formulas (1) and (2) above). While these (national) forecasts are considered independent of each other, performance figures for other countries (like Norway and Switzerland) can be added as indicated.
As noted, the time series are based on data since 1980. The rightmost column of the table provides the beginning date on which each best estimate is based. With the exception of the U.K. and Belgium, only the most recent years are needed for the prediction in the case of the EU countries, the U.S.A., and Japan. These results suggest that the network of lateral relations among the countries works to mitigate the influence of the historical trajectories.
Note that our argument against systemness was not an argument in favour of unrelatedness, since the outcome of the test was mainly undecisive. In the 1990s, path-dependency in the data, both at the European and at the global level, suggests trajectory formation at the supra-national level, yet not systemness. The important exceptions of the U.K. and Canada (cf. Andersen et al. 1988), which typically maintain a position on the basis of their strong historical records, may illustrate that countries can differ in terms of their sensitivity to the network formation.
8. Policy Implications
If the R&D system is integrated at a level different from the economic system, this calls for a further reflection about the function of RTD-policies as developed by the European Commission. The objective of further integration may be less important in these policies than their function of keeping the European R&D system in good shape to meet competition from the outside world given the increasingly knowledge-based economy. The Framework (and other such) Programs can then be considered as resource allocations for this purpose, but the output is still integrated at the national level, on the one hand, and at the global level, that is, in disciplinary frameworks, on the other.
From this perspective, the European programs have been successful by contributing resources to (nationally integrated) R&D systems which have been in transition to a variable degree. During the period under study, Italy and Spain have been the main contributors to the spectacular growth rates. These countries (perhaps) more than others have made their research potentials internationally visible by publishing increasingly in the international literature. A similar development can be observed in the case of the Netherlands during the 1980s. After a period of transformation, the exploitation of the former GDR and its research potential by the international R&D system seems to have gained momentum in recent years.
In my opinion, the firmly integrated national systems are under pressure to internationalize their research potential (as a resource base for their national economies). The respective political systems have been successful in guiding this international transition to a regime of university-industry-government relations, but in varying degrees (Leydesdorff & Gauthier 1996). For example, the Eastern European and FSU systems got stuck in this process during the 1980s because of a lock-in of industry and government in a previous mode of production (Leydesdorff & Etzkowitz 1998).
As a consequence of the internationalization of national R&D systems, the systems which have been historically integrated in the global R&D system (like the U.S.A. and the U.K.) tend relatively to lose in terms of percentage of world share in comparison to systems which still have considerable internal resources allocated at the national level (e.g., Japan). Thus, our results suggest that world trade may be a more important metaphor for understanding the drivers of these developments than relations with (local) innovation and regional developments. Most likely, the EU countries are trading more with each other (in terms of coauthorship relations and citations) than with the rest of the world. Such a pattern would explain the lag in the coupling which we found: the network has a significant function, but it is not (yet) visible at the level of an integrating system.
The author acknowledges partial funding by the program for Targeted Social-Economic Research of the European Commission, project nr. SOE1-DT97-1060 ("The Self-Organization of the European Information Society").
References
Andersen, J., P. M. D. Collins, J. Irvine, P. A. Isard, B. R. Martin, F. Narin, & K. Stevens, On-line approaches to measuring national scientific output-- A cautionary tale, Science and Public Policy 15 (1988) 153-61.
Braun, Tibor, Wolfgang Glänzel, & Andras Schubert, Assessing Assessments of British Science. Some Facts and Figures to Accept or Decline, Scientometrics 15 (1989) 165-70.
Foray, Dominique, Errors and mistakes in technological systems: from potential regret to path dependent inefficiency. In: J. Lesourne and A. Orlean (Editors), Advances in Self-Organization and Evolutionary Economics (Economica, Paris, etc. 1998), pp. 217-239.
Frenken, Koen, & Loet Leydesdorff, Scaling Trajectories in Civil Aircraft (1913-1997), Research Policy (forthcoming).
Fujigaki, Yuko, The Citation System: Citation Networks as Repeatedly Focusing on Difference, Continuous Re-evaluation, and as Persistend Knowledge Accumulation, Scientometrics 43 (1998) 77-86.
Glänzel, Wolfgang, Andras Schubert, & Hans-Jürgen Czerwon, A Bibliometric Analysis of International Scientific Cooperation of the European Union (1985-1995), Scientometrics 45 (1999) 185-202.
Ingewersen, Peter, On-line indicators of Danish biomedical publication behaviour 1986-96: international visibility, impact and co-operation in a Scandinavian and world context, Research Evaluation 8 (1999) 39-45.
Ingewersen, Peter, & Finn H. Christensen, Data set isolation for bibliometric on-line analysis of research publications: fundamenal methodological issues, Journal of the American Society for Information Science 48 (1997) 205-217.
Leydesdorff, Loet, Problems with the 'measurement' of national scientific performance, Science and Public Policy 15 (1998) 149-152.
Leydesdorff, Loet, The Impact of EC Science Policies on the Transnational Publication System, Technology Analysis and Strategic Management 4 (1992) 279-298.
Leydesdorff, Loet, The Challenge of Scientometrics: The development, measurement and self-organization of scientific communications. Leiden: DSWO Press, Leiden University, 1995.
Leydesdorff, Loet, & Henry Etzkowitz, The Triple Helix as a model for innovation studies, Science and Public Policy 25 (1998) 195-203.
Leydesdorff, Loet, & Élaine Gauthier, The Evaluation of National Performance in Selected Priority Areas using Scientometric Methods, Research Policy 25 (1996) 431-50.
Leydesdorff, Loet, & Nienke Oomes, Is the European Monetary System Converging to Integration? Social Science Information 38 (1999) 57-85.
Liebowitz, S. J., & Stephen E. Margolis, Path Dependence, Lock-In, and History, The Journal of Law, Economics, & Organization 11 (1995) 202-226.
Maturana, Humberto R., & Francisco J. Varela, Autopoiesis and Cognition: The Realization of the Living, Reidel, Dordrecht, etc., 1980.
Scharnhorst, Andrea, Citation Networks, Science Landscapes and Evolutionary Strategies, Scientometrics 43 (1998) 95-106.
Shannon, Claude E., A Mathematical Theory of Communication. Bell System Technical Journal, 27 (1948) 379-423 and 623-56.
Theil, Henry, Applied Economic Forecasting. North-Holland, Amsterdam, 1966.
Theil, Henry, Statistical Decomposition Analysis. North-Holland, Amsterdam, 1972.
Van Raan, Anthony F. J., Science as an international enterprise, Science and Public Policy 24 (1997) 290-300.
Table 1
Prediction of national percentage shares of publications for 1999
|
|
(prediction) |
first year included in the prediction | |
| Belgium
Denmark France Germany Greece Ireland Italy Luxembourg Netherlands Portugal Spain U.K. *) (EC total Austria Finland Sweden (EU total U.S.A. Japan Norway Switzerland Israel Canada *) |
1.3165
1.0198 6.5159 8.8291 0.6026 0.3300 4.1350 0.0110 2.4491 0.3270 2.8465 8.9366 33.8616 0.9026 0.8947 1.9542 35.7794 31.6623 9.4394 0.7095 1.8055 1.1623 4.1775 |
1.3597
1.0589 6.6476 9.2176 0.6480 0.3475 4.2133 0.0122 2.4540 0.3621 3.0380 8.9468 34.3386 0.9441 0.9142 1.9673 37.3091 31.0931 9.7012 0.7414 1.8217 1.1696 4.1867 |
1996 1996 1996 1995 1996 1996 (1988) 1996 1996 1995 1980 1995) 1994 1996 1995 1996) 1996 1994 1989 1993 1994 1980 |
*) 1980 was the first year included in the longitudinal data.
1. The field "reviews" was combined with "bibliographies" for the years 1974-1988 in the on-line version of this database.
2. In addition to Luxembourg, the number of reviews for Portugal is sometimes also zero, for example.
3. The corresponding growth for Japanese articles over this period is 0.217% per year (r > 0.98).
4. The precise values of the mean in this data are -0.0115 mbit for the EU (articles, reviews, and letters), -0.0094 for the EU in the case of only articles, and -0.089 for the global comparison between the EU, the U.S.A., and Japan. Thus, the assumption of systemness in the data is always rejected, but remains somewhat stronger in the European case than in the global comparison.