1. Introduction
The Journal Citation Reports (JCR) of the (Social)
Science Citation Index contain structural information about citation-relation
patterns of journals at the aggregated level for each year. The aggregated
journal-journal citation matrices based on this data can be analyzed in terms
of their structural dimensions using, for example, factor analysis (Doreian
& Farraro, 1985; Leydesdorff, 1986; Tijssen et al., 1987). Additionally,
graph-analytical approaches enable us to visualize this data in terms of centrality
measures (Freeman, 1977 and 1978/1979; De Nooy et al., 2005). In the
case of journal maps, the clusters can be designated in terms of scientific
specialties (Boyack et al., 2005; De Moya-Anegón et al., 2007).
By comparing data for different years, one can attempt to
indicate structural change in addition to structure in the data at each
moment of time. The structural model is static and contains necessarily an
assumption about the number of factors (Leydesdorff, 2006). However, the number
of relevant dimensions may also vary over time. If both the factor loadings and
the factors themselves are allowed to vary over time, the models become
unidentifiable without further assumptions. Changes in observable variation
have hitherto been difficult to distinguish from changes in latent structures.
Using time-series analysis, one first has to estimate the
extent to which the variation among different years is auto-correlated. If the
measurements (for different moments of time) are auto-correlated, the error
terms are also correlated, and this violates an assumption in a regression
model. However, ARIMA—Auto-Regression Integration and Moving
Average—models (available as a routine in SPSS) have not yet been developed
for a large number of variables as in the case of matrices (networks, graphs)
developing over time. Furthermore, substructures of citation matrices may
evolve at different speeds. For example, the cited half-life times of journals
containing mainly letters or reviews are significantly different within
otherwise homogenous fields of science (Leydesdorff, 2008).
Recent developments in visualization and animation techniques
have placed the problem of distinguishing structural change from variation once
again on the agenda. Most techniques for dynamic visualizations are based on
smoothing the transitions by linear interpolation between static
representations in order to optimize the conservation of a mental map (Moody et
al., 2005; De Nooy et al., 2005; Bender-deMoll & McFarland, 2006).
In this study, we use an MDS-based algorithm to layout time series of network
data dynamically by optimizing the stress both within each year and over
consecutive years, that is, by optimizing in three dimensions of the data (Erten
et al., 2004; Gansner et al., 2005; Baur & Schank, 2008). The
new algorithm was recently implemented in Visone. Visone is a
software package for the visualization of network data (Baur et al.,
2002; Brandes & Wagner, 2004). The version with this routine added can be
web-started from http://www.visone.info/dynamic
or downloaded as stand-alone at http://www.leydesdorff.net/visone/index.htm.
We apply the new algorithm to three evolutions of citation
impact environments of journals for which an expectation about
interdisciplinary developments could be specified on the basis of previous
research:
1. In the
case of Cognitive Science, we elaborate on a study by Goldstone &
Leydesdorff (2006) which analyzed JCR data for 2004 in order to validate the
expectation of the editors of the journal that Cognitive Science could play
an interdisciplinary role in its relevant field (Collins, 1977). Goldstone
& Leydesdorff (2006) found the highest betweenness centrality for this
journal in its citation impact environment in 2004 and conjectured that
betweenness centrality would remain high across the years;
2. In the
case of Social Networks, Leydesdorff (2007) found high betweenness
centrality of the journal in its citation impact environment in 2004. The field
of (social) network analysis has gone through a turbulent transition period thanks
to the development of internet research (Otte & Rousseau, 2002; Barabási
& Albert, 1999). Fortunately, the period of this relatively recent “revolution”
(Kuhn, 1962) is covered by the JCR-data (which have been available electronically
since 1994). When did the interdisciplinary position of Social Networks emerge?
Could it be sustained?
3. Nanotechnology
has been a priority funding area for governments in the twenty-first century
(Kostoff et al., 2007). Aggregated citation data for the journal Nanotechnology
have been available since 1996, and its position can therefore be used as an
indicator of the evolution of this field during the period 1996-2006
(Leydesdorff & Zhou, 2007).
2. Data and Methods
The data is collected from the Journal Citation Reports of the
Science Citation Index and the Social Science Citation Index. The
information available in both databases was combined using relational database
management. As noted, the data have been available in electronic format since
1994, but on a yearly basis. The last year available at the time of this
analysis (December 2007) was 2006.
Citation matrices among journals are asymmetrical since the journals
are both citing each other and cited by each other. In this study, we use only
the cited structures, since we are interested in the citation impact
environments. All journals citing the specific seed journal under study are included
in each year. Note that the JCR does not include all journals in the tail of
the distributions, but subsumes them under “All Others.” This information was not
included because it cannot be made meaningful for the interpretation.
The citation patterns in the matrices are normalized using
the cosine as a similarity measure (Salton & McGill, 1983; Ahlgren et al.,
2003; Leydesdorff & Vaughan, 2006). While the Pearson correlation
normalizes with reference to the arithmetic mean, the cosine normalizes with
reference to the geometric mean (Jones & Furnas, 1987). This is convenient
when the purpose is to visualize skewed distributions. Because the cosine
varies from zero to one, a threshold is needed if one wishes to visualize structure
in the data. In order to maintain consistency with previous studies (Goldstone
& Leydesdorff, 2006; Leydesdorff, 2007), the threshold is set at cosine
≥ 0.2 in the first two case studies. In the case of the citation
environment of Nanotechnology, however, the threshold had to be set at a
higher value (cosine ≥ 0.5) because citation networks in the natural
sciences are populated more densely than in the social sciences (Leydesdorff,
2003). Betweenness centrality is calculated on the basis of the respective
vector spaces and separately for each year.
The cosine-normalized matrices are converted into a
time-sliced Pajek project using Pajek itself and dedicated software.
These files can be read into Visone, PajekToSVGAnimation or SoNiA
(Social Networks Image Animator) for further processing.
In collaboration with the team that developed Visone (Görke et al.,
2007; Baur & Schank, 2008), a dynamic solution for the animation was implemented
based on optimization of stress both for each year and over the years.
The approach falls into the category of MDS-based methods. In
their seminal work, Kamada and Kawai (1989) reformulated the problem of
achieving graph-theoretical target distances in terms of energy optimization.
They formulated the ensuing stress in the graphical representation as follows:
 with
with  (1)
(1)
where for each pair of nodes i and j, the
parameter dij is the distance making the shortest path
between this pair. However, Kruskal’s (1973) stress value for MDS was defined
differently (e.g., Kruskal & Wish, 1978; Borgatti, 1998), notably as
follows:
 (2)
(2)
Equation 2 differs from Equation 1 by taking the square root
and because of the weighing of each term with 1/dij2
in the numerator of Equation 1. This weight is crucial for the quality of the
layout, but defies normalization with ∑ dij2
in the denominator and hence the comparability between these two stress values.
Gansner et al. (2005) improved on the algorithm of
Kamada & Kawai (1989) by minimizing a so-called majorant of the
stress-function S. Using a number of empirical cases, they showed that
their approach converges much faster, is less sensitive to local minima, and further
minimizes the stress function provided in Equation 1. In addition to these
methodological advantages, the majorant can also be implemented using an
algorithm that is more compact and faster than that of Kamada & Kawai
(1989).
We extended this algorithm to layout dynamic networks (Baur
& Schank, 2008). The corresponding dynamic stress function is provided by
the following equation:
 (3)
(3)
In Equation 3, the left-hand term is equal to the static
stress, while the right-hand term adds the dynamic component, namely the stress
between subsequent years. If the weighting factor ω for this dynamic
extension is set equal to zero, the method is equivalent to the static analysis
and the layout of each time frame is optimized independently. The dynamic
extension penalizes drastic movements of the position of node i at time t
(xi,t) toward its next position (xi,t+1)
by increasing the stress value. Thus, stability is provided in order to
preserve the mental map between consecutive layouts so that an observer can easily
identify corresponding graph structures. Preserving the mental map is a crucial
point in computing dynamic layouts (Misue et al., 1995).
In other words, the configuration for each year can be
optimized in terms of the stress in relation to the solutions for previous years
and in anticipation of the solutions for following year. In principle, the
algorithm allows us (and Visone enables us) to extend this to more than
a single year, but in this study the optimization is extended by only one year
in both directions (that is, including t + 1 and t – 1). Note
that this approach is different from the approach that takes the solution for
the previous moment in time as a starting position for iterative optimization
according to Equation 1. The nodes are not repositioned given a previous configuration,
but the previous and the next configurations are included in the algorithmic
analysis for each year.
Technically, the equation to be optimized computes iteratively
a new position for each node (xi) on dimension d, as
follows:
new– (4)
(4)
until the aggregated stress comes below a threshold value or
during a fixed number of iterations. Again, the left-hand term (between
brackets in both the numerator and the denominator of Equation 4) accounts for
the static solution, while the right-hand terms contain the extensions with the
stress in comparison to the previous (t–1) and next (t+1) moments
in time. Higher values of the weighting factor for the dynamic extension (ω)
result in increased stability of the representations over the years.
Like various other parameters, one
can experiment with this weight function using Visone. Visone offers
as a further advantage that one can animate using the sizes of the nodes as indicators
of the various centrality measures. Other animation programs like PajekToSVGAnim
or SoNIA cannot accommodate these values in the animations without
extensive preprogramming. Pajek, for example, stores this information
separately in a vector. In order to enhance the readability of the animations, isolates
and small components which were not related to the largest component in any of
the years under study, were removed.
3. Results
3.1 Cognitive
Science
Goldstone & Leydesdorff (2006) analyzed the citation
impact environment of Cognitive Science in 2004. The journal had 1,113
citations in this year, spread across 180 journals; 164 of these journals formed
a single component when a threshold of cosine ≥ 0.2 was applied (Figure
1). The two largest clusters of journals citing Cognitive Science in
2004 were cognitive psychology and computer science, with neuroscience rather
densely interconnected with psychology. Education, linguistics, and philosophy
journals all had presences in the cited environments of the journal that are stronger
than in its citing networks.
In other words, Cognitive Science was cited by
journals in otherwise poorly related fields. This can be seen upon visual
inspection of Figure 1: betweenness centrality is used as a measure for the
sizes of the nodes. The betweeness centrality of Cognitive Science in
this vector space was 30.3%, whereas the second-largest betweeness value in
2004 was 5.1% for Annual Review of Psychology.
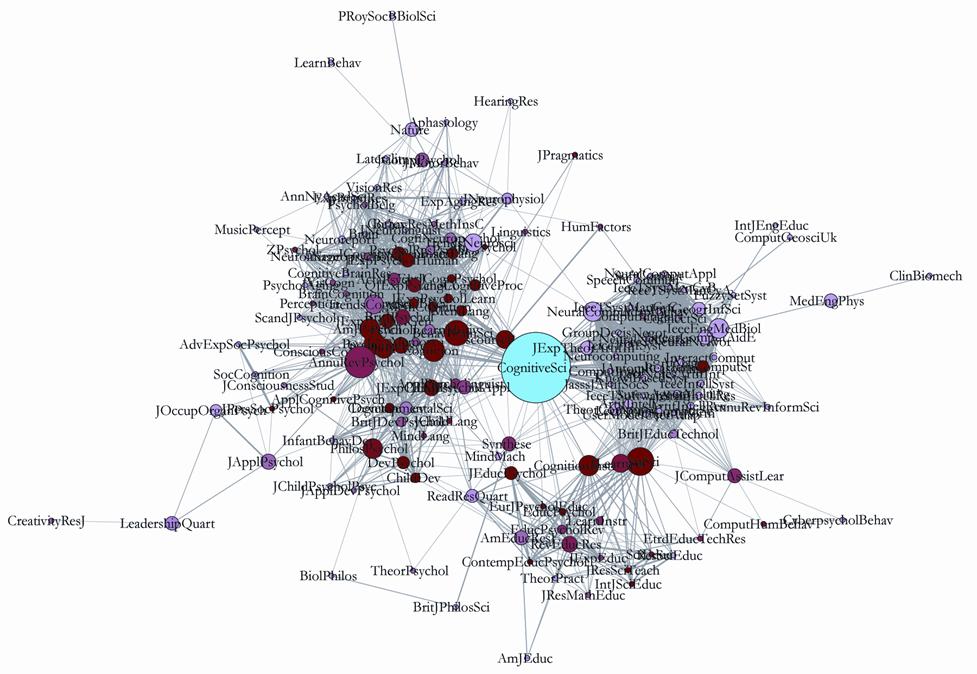
Figure 1: Betweenness centrality of 164 journals in
the citation impact environment of Cognitive Science in 2004; cosine
> 0.2.
The pronounced betweenness centrality of the journal accords
with the aspiration of the editors to provide an interdisciplinarity meeting
place for scholars approaching problems of cognition from different
disciplinary angles (Collins, 1977). Goldstone & Leydesdorff (2006, at p.
988) explored this property longitudinally on the basis of a comparison with
similar data for 1988, and found also in that year a strongly mediating role for
the journal among psychology, computer science, and education.
Using exactly the same methods as these authors, an animation
of the journal’s betweenness centrality in the vector space during the period
1994-2006 is available at http://www.leydesdorff.net/journals/cognsci/index.htm.
The animation shows that the betweenness centrality of the journal in this
network is high in all these years, but that the relevant environments change over
the years, with the exception of the educational field, which is connected to
the field of cognitive psychology by the citation patterns of the journals Cognitive
Science and Cognitive Instruction, respectively. However, the
relation to journals in the computer sciences that was found in 2004 can be
considered as an exception rather than the rule.
In summary, Cognitive Science functions at the margins
of cognitive psychology in virtually all the years with the specific function
of relating this specialty to specialties in other (sub)disciplines, that is, across
disciplinary divides. Its citation relation with education science research is
stable. However, the original vision of Collins (1977) of starting the journal
in order to add “another trapping in the formation of a new discipline” (p. 1)
has not been realized. The journal has a strongly interdisciplinary character,
but the mother disciplines (psychology and education research) have remained dominant
frames of reference for the journal’s “interdisciplinary” development.
b. Social Networks
When Social Networks was launched in 1978, it added a
new communication channel to a set of journals that focus on quantitative
methodologies in sociology. The journal can also be considered as a sociological
pendant of journals about psychometrics, econometrics, biometrics, etc.
However, models of neural networks in psychology and biology focus on dynamic
properties of networks, while social network analysis was developed primarily as
a toolbox for the analysis of the structural properties of networks (Burt, 1982
and 1987; Freeman, 1977 and 1978/1979; Wasserman & Faust, 1994). The
development of the scholarly journal and the corresponding specialty have been closely
linked to the development of computer programs like UCINet, Structure,
Mage, Visone, and Pajek (Freeman, 2004).
The advent and growth of the Internet during the 1990s
generated huge interest in the techniques developed within this field (e.g.,
centrality measures) among both social and natural scientists. Figure 2 shows
the resulting configuration in terms of the betweenness centrality of the journal
in 2004: 43 of the 54 journals citing Social Networks during this year
are connected at the level of cosine ≥ 0.2 (Leydesdorff, 2007). The
journal has a central position in Figure 2 between the fields of sociology and
management science, on the one hand, and branches of the exact sciences
focusing on network analysis, on the other. The Journal of Mathematical
Sociology and Organization Science support this construction of an
interface between clusters with social and natural science journals,
respectively.
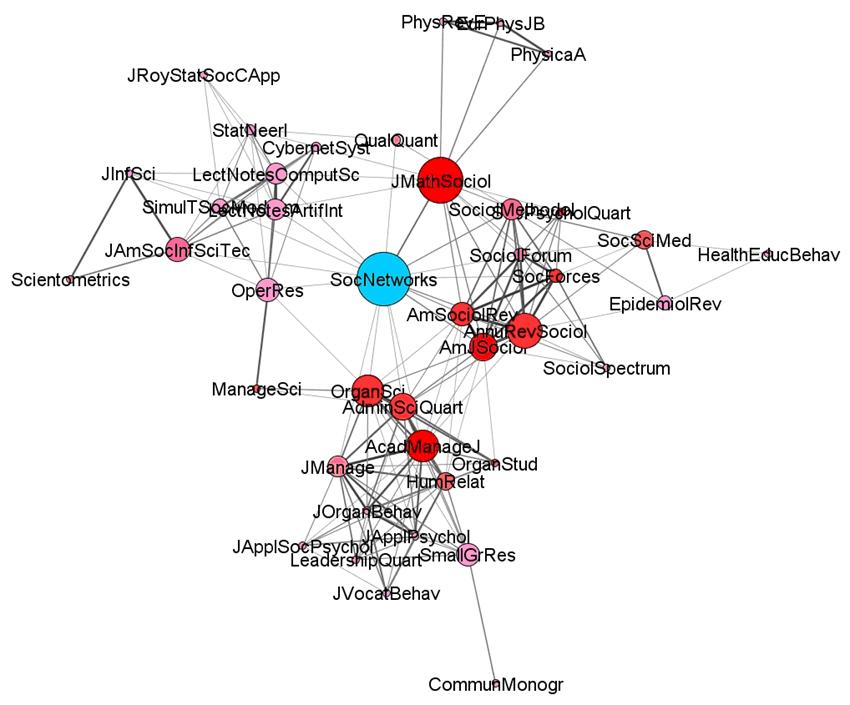
Figure 2: Betweenness centrality of 43 journals in
the vector space of the citation impact environment of Social Networks
(cosine ≥ 0.2).
Can this interdisciplinary position be maintained over the
years? The animation for the period 1994-2006 (available at http://www.leydesdorff.net/journals/socnetw/index.htm)
suggests differently. In the first years, Social Networks is clearly
visible as a sociology journal—related most closely to the American
Sociological Review and the American Journal of Sociology as leading
journals in the field—and in all years the citation pattern of the journal is primarily
attributed to this group. However, the journal definitively gained interest in a
set of management journals during the second half of the 1990s.
In some years more than others, the journal’s citation
pattern moved away from the sociology core group, but this movement was not
consolidated. Thus, the journal’s interdisciplinary ambitions are offset
against its disciplinary identity. This leads to a pattern of alteration
between years in which the disciplinary citation pattern competes with the interdisciplinary
orientation. As noted, the position of the journal between sociology and
management science was consolidated during the last decade.
c. Nanotechnology
The journal Nanotechnology was included in the Science
Citation Index in 1996, and thus the animation (available at http://www.leydesdorff.net/journals/nanotech/index.htm)
covers only the decade 1996-2006. The animation shows that this journal was first
embedded in the field of “applied physics” journals, but then became an increasingly
central focus of attention within this specialty towards the end of the millennium.
In the period 2000-2003, nanotechnology became a priority funding area in most
advanced nations (Zhou & Leydesdorff, 2006; Kostoff et al., 2007).
At the level of aggregated journal-journal citations, this “revolution”—in the
funding?—led to a reorganization of the interface between applied physics and
physical chemistry.
The journal Nanotechnology played an important role
in this reorganization of interdisciplinary development at the field level.
First, the attention of citing journals in the field of applied physics was
focused on this journal. Thereafter, chemistry journals began to pay increasingly
attention to this field. In 2001, Nanotechnology as a specialist journal
took the interdisciplinary role at this interface over from Science
which had made this connection in 2000 (Figure 3).
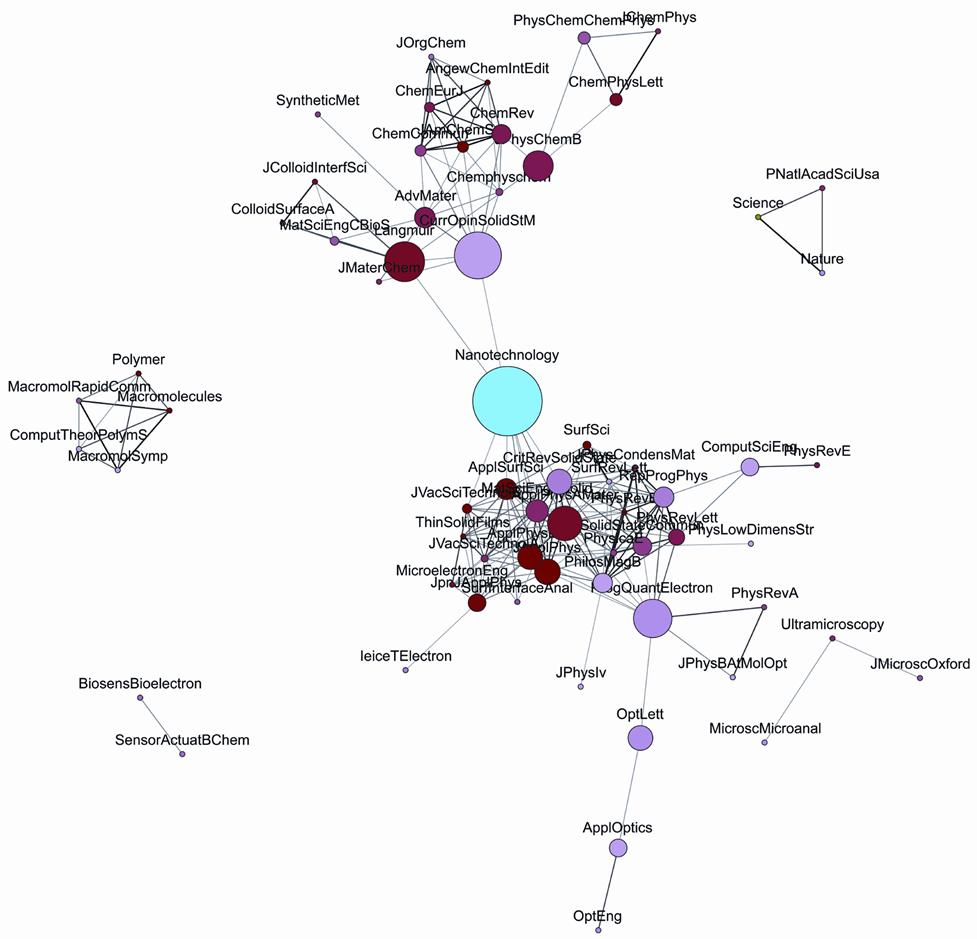
Figure 3: Betweenness centrality of Nanotechnology
between clusters of journals in applied physics and chemistry, in 2001.
New journals emerged in the years thereafter, among them Nano
Letters published by the influential American Chemical Society since 2001.
As could be expected (Bensman, 1996), this latter journal took the lead in
terms of the impact factors among the specialist journals at the interface
between applied physics and physical chemistry. At the same time, the
multidisciplinary journal Science began to participate in the
fine-grained citation environment of these specialisms, and the journal Nanotechnology
lost its catalyzing function at the interface.
Figure 4 shows the catalyzing role of the journal during the
transition period in terms of the development of its betweenness centrality in
the field. Before and after the transition the journal was firmly embedded and
did not play a role at an interdisciplinary interface. During the period of
transition, however, the journal reflected the turmoil in its citation
environment. Betweenness centrality in its vector space increased to 27.5% in
2001. After the transition period this interdisciplinary role was taken over by
a number of nanoscience journals that had emerged in the meantime (Leydesdorff
& Zhou, 2007; Leydesdorff, forthcoming). The journal Science
(and to a lesser extent Nature) played a role in shaping the interface
in 2000 and thereafter.
Figure 4: The development of betweenness centrality
of Nanotechnology in its citation impact environment during the period
1996-2006.
4. Conclusions and discussion
The interdisciplinarity of new developments in science has a
high policy relevance. Proponents of new developments often proclaim that the
existing disciplinary structures do not sufficiently honor the potential
benefits of intellectual synergy in interdisciplinary projects. Policy-makers are
sympathetic to these claims, since integration and problem-orientation is
emphasized as opposed to differentiation and specialization.
In Leydesdorff et al. (1994), we argued that new
developments in science first manifest as specific journals focusing on the issues
under study. The new journal attracts the attention of scholars in neighboring
disciplines, and this can be measured in terms of being cited. (In terms of
probabilistic entropy, one might say that the new developments increase the local
temperature in the database [Kostoff, 1997; Leydesdorff, 2003].) The focus of
this study was to examine whether this specific function of interdisciplinary
mediation among disciplinary structures could also be stabilized over time. The
case studies teach us that this is not always the case, and such mediation
seldom leads to the stabilization of an interface beyond two specialties
(Leydesdorff, 1992).
Cognitive Science provides an example of a journal that
deliberately searches its relevant environments for potential audiences for new
knowledge claims that are obtained mainly from new developments in cognitive
psychology. The interface with education research was firmly stabilized during
this decade, and the journal receives a sufficiently large number of citations
from outside its original discipline to maintain high betweenness centrality in
its relevant citation environment. However, the relations with cognitively more
remote specialties remain in flux.
The journal Social Networks first crystallized as a
methods journal in sociology during the 1980s, but then experienced the
Internet revolution during the 1990s. Actually, the journal could have been
expected to develop into a center for these activities, but this did not happen.
The relationship with management journals was firmly established on the side of
the social sciences involved, but the physics journals involved in Internet
research (e.g., Physics Review E) do not cite this journal regularly enough
for it to become an interdisciplinary node between the natural and social
sciences. Instead, the citation pattern in most of the years has remained encapsulated
in the mother discipline.
In the case of nanotechnology, the intellectual fields of
applied physics and relevant chemistry have undergone reorganization during the
period under study. The field of nanotechnology emerged as a specific domain of
application in physics, on the one hand, and in chemistry, on the other, with a
specific focus on nanostructures (e.g., fullerenes and nanotubes; Lucio-Arias
& Leydesdorff, 2007). The journal Nanotechnology, which existed
before the “revolution”—or the “surge in funding”— played a role among other
journals in applied physics first by catching the attention to the nano-field
among physicists and then in forging a relationship with chemistry. The latter
relationship transformed the field of advanced material sciences into a
citation cluster at the interface of applied physics and physical chemistry.
In summary, the claim of “interdisciplinarity” eventually seems
in practice to lead to the emergence of a specific interface between two existing
specialties and the potential reorganization of that interface into a
coevolution. This accords with the evolutionary expectation, because the
interfacing of more than two disciplinary codes of communication could easily
lead to confusion and thus impede intellectual development. The reach beyond a
single interface tends to remain incidental, and countervailing tendencies
towards intellectual differentiation and disciplinary identification can also
be expected. These different tendencies may even lead to alterations over the
years.
Furthermore, we did not witness the emergence of stable
interfaces between the social and natural sciences in these case studies,
although the development of such an interface could have been expected in the
cases of Social Networks and Cognitive Science. Perhaps the
formation and stabilization of an interdisciplinary interface between the
social and natural sciences would be “a bridge too far” given the centrifugal
forces of cognitive codes of communication (e.g., the use of very different
methodologies) in each of the disciplines involved.
return
Acknowledgements
The authors are grateful to Diana Lucio-Arias, Wouter de
Nooy, and Andrea Scharnhorst for the discussion of previous drafts.
References
Ahlgren, P.,
Jarneving, B., & Rousseau, R. (2003). Requirement for a Cocitation
Similarity Measure, with Special Reference to Pearson's Correlation
Coefficient. Journal of the American Society for Information Science and
Technology, 54(6), 550-560.
Barabási, A. L.,
& Albert, R. (1999). Emergence of Scaling in Random Networks. Science, 286(5439),
509.
Baur,
M., Benkert, M., Brandes, U., Cornelsen, S., Gaertler, M., Köpf, B., Lerner,
J., & Wagner, D. (2002). Visone Software for Visual Social Network
Analysis. Proc. 9th Intl. Symp. Graph Drawing (GD’01). Lecture
Notes of Computer Science, 2265, 554-557.
Baur, M. &
Schank, T., 2008. Dynamic Graph Drawing in Visone. Technical University Karlsruhe, Karlsruhe. Available at http://i11www.ilkd.uni-karlsruhe.de/people/schank/publications/bs-dgdv-08.pdf
(retrieved on Apr. 22, 2008).
Bender-deMoll,
S., & McFarland, D. A. (2006). The art and science of dynamic network
visualization. Journal of Social Structure, 7(2).
Bensman, S. J.
(1996). The structure of the library market for scientific journals: The case
of chemistry. Library Resources & Technical Services, 40, 145-170.
Borgatti, S.
(1998). Social Network Analysis Instructional Website, at http://www.analytictech.com/networks/mds.htm
(retrieved on Jan. 25, 2008).
Boyack,
K. W., Klavans, R., & Börner, K. (2005). Mapping the Backbone of
Science. Scientometrics, 64(3), 351-374.
Brandes, U.,
& Wagner, D. (2004). visone – Analysis and Visualization of Social
Networks. In M. Jünger & P. Mtuzel (Eds.), Graph Drawing
Software (pp. 321-340): Springer.
Burt, R. S.
(1982). Toward a Structural Theory of Action. New York, etc.: Academic
Press.
Burt, R. S.
(1987). Structure. Version 3.2, Technical Report # TR2. New York: Columbia University.
Collins, A.
(1977). Why cognitive science? Cognitive Science, 1, 1-2.
De Moya-Anegón,
F., Vargas-Quesada, B., Chinchilla-Rodríguez, Z., Corera-Álvarez, E.,
Munoz-Fernández, F. J., & Herrero-Solana, V. (2007). Visualizing the marrow
of science. Journal of the American Society for Information Science and
Technology, 58(14), 2167-2179.
De Nooy, W.,
Mrvar, A., & Batagelj, V. (2005). Exploratory Social Network Analysis
with Pajek. New York: Cambridge University Press.
Doreian, P.
(1986). A Revised Measure of Standing of Journals in Stratified Networks,. Scientometrics
11, 63-72.
Doreian, P.,
& Fararo, T. J. (1985). Structural Equivalence in a Journal Network. Journal
of the American Society for Information Science, 36, 28-37.
Erten, C.,
Harding, Ph. J., Kobourov, S. G., Wampler, K., & Yee, G. V. (2004). GraphAEL:
Graph animations with evolving layouts. Pages 98-110 in Liotta, G., Editor, Graph
Drawing, Perugia, Italy, September 21-24, 2003; Springer, 2004.
Freeman, L. C.
(1977). A Set of Measures of Centrality Based on Betweenness. Sociometry, 40(1),
35-41.
Freeman, L. C.
(1978/1979). Centrality in Social Networks: Conceptual Clarification. Social
Networks, 1, 215-239.
Freeman, L. C.
(2004). The Development of Social Network Analysis: A Study in the Sociology
of Science: BookSurge.
Gansner, E. R.,
Koren, Y., & North, S. (2005). Graph Drawing by Stress Majorization. In J.
Pach (Ed.), Graph Drawing, Lecture Notes in Computer Science (Vol. 3383,
pp. 239-250). Berlin/Heidelberg: Springer.
Goldstone, R.,
& Leydesdorff, L. (2006). The Import and Export of Cognitive Science.
Cognitive Science, 30(6), 983-993.
Görke, R.,
Schank, T., & Wagner, D. (2007). Static and Dynamic Visual Analysis of a
Co-Author Network. Available at http://i11www.iti.uni-karlsruhe.de/people/schank/gd07cont/schank-gd07cont.pdf
(30 January 2008).
Jones,
W. P., & Furnas, G. W. (1987). Pictures of Relevance: A Geometric
Analysis of Similarity Measures. Journal of the American Society for
Information Science, 36(6), 420-442.
Kamada, T., &
Kawai, S. (1989). An algorithm for drawing general undirected graphs. Information
Processing Letters, 31(1), 7-15.
Kostoff,
R. N., Eberhart, H. J., & Toothman, D. R. (1997). Database
tomography for information retrieval. Journal of Information Science, 23(4),
301.
Kostoff,
R. N., Koytcheff, R. G., & Lau, C. G. Y. (2007). Global
nanotechnology research metrics. Scientometrics, 70(3), 565-601.
Kruskal, J. B.,
& Wish, M. (1978). Multidimensional Scaling. Beverly Hills, CA: Sage Publications.
Kuhn, T. S.
(1962). The Structure of Scientific Revolutions. Chicago: University of Chicago Press.
Leydesdorff, L.
(1986). The Development of Frames of References. Scientometrics 9,
103-125.
Leydesdorff, L.
(1990). The Prediction of Science Indicators Using Information Theory. Scientometrics
19, 297-324.
Leydesdorff, L.
(1991). The Static and Dynamic Analysis of Network Data Using Information
Theory. Social Networks, 13, 301-345.
Leydesdorff, L.
(1992). Irreversibilities in Science and Technology Networks: An Empirical and
Analytical Approach. Scientometrics, 24, 321-357.
Leydesdorff, L.
(2002). Indicators of Structural Change in the Dynamics of Science: Entropy
Statistics of the SCI Journal Citation Reports. Scientometrics, 53(1),
131-159.
Leydesdorff, L.
(2003). Can Networks of Journal-Journal Citations Be Used as Indicators of
Change in the Social Sciences? Journal of Documentation, 59(1), 84-104.
Leydesdorff, L.
(2006). Can Scientific Journals be Classified in Terms of Aggregated
Journal-Journal Citation Relations using the Journal Citation Reports? Journal
of the American Society for Information Science & Technology, 57(5),
601-613.
Leydesdorff, L. (2007).
“Betweenness Centrality” as an Indicator of the “Interdisciplinarity” of
Scientific Journals. Journal of the American Society for Information Science
and Technology, 58(9), 1303-1309.
Leydesdorff, L.
(2008a). Caveats for the Use of Citation Indicators in Research and
Journal Evaluation. Journal of the American Society for Information Science
and Technology, 59(2), 278-287.
Leydesdorff, L.
(2008b). The delineation of nanoscience and nanotechnology in terms of journals
and patents: a most recent update. Scientometrics 76(1), forthcoming.
Leydesdorff, L.,
Cozzens, S. E., & Besselaar, P. v. d. (1994). Tracking Areas of Strategic
Importance using Scientometric Journal Mappings. Research Policy, 23,
217-229.
Leydesdorff, L.,
Schank, T., Scharnhorst, A., & De Nooy, W. (in preparation). Animating the
Development of Social Networks over Time using a Dynamic Extension of
Multidimensional Scaling.
Leydesdorff, L.,
& Vaughan, L. (2006). Co-occurrence Matrices and their Applications in
Information Science: Extending ACA to the Web Environment. Journal of the
American Society for Information Science and Technology, 57(12), 1616-1628.
Leydesdorff, L.,
& Zhou, P. (2007). Nanotechnology as a Field of Science: Its Delineation in
Terms of Journals and Patents. Scientometrics, 70(3), 693-713.
Lucio-Arias, D.,
& Leydesdorff, L. (2007). Knowledge emergence in scientific communication:
from “fullerenes” to “nanotubes”. Scientometrics, 70(3), 603-632.
Misue,
K., Eades, P., Lai, W., & Sugiyama, K. (1995). Layout adjustment and
the mental map. J. Visual Languages and Computing, 6(2): 183-210.
Moody, J.,
McFarland, D., & Bender-deMoll, S. (2005). Dynamic Network Visualization. American
Journal of Sociology, 110(4), 1206-1241.
Otte, E., &
Rousseau, R. (2002). Social network analysis: a powerful strategy, also for the
information sciences. Journal of Information Science, 28(6), 441-453.
Salton, G., &
McGill, M. J. (1983). Introduction to Modern Information Retrieval. Auckland, etc.: McGraw-Hill.
Theil, H. (1972).
Statistical Decomposition Analysis. Amsterdam/ London:
North-Holland.
Tijssen,
R., de Leeuw, J., & van Raan, A. F. J. (1987). Quasi-Correspondence
Analysis on Square Scientometric Transaction Matrices. Scientometrics 11,
347-361.
Wasserman, S.,
& Faust, K. (1994). Social Network Analysis: Methods and Applications.
New York, etc.: Cambridge University Press.
Zhou, P., &
Leydesdorff, L. (2006). The emergence of China as a leading nation in science. Research Policy, 35(1), 83-104.
return