return

Clustering Methodologies for Identifying Country Core Competencies, Journal of Information Science, 33(1), 21-40.

Ronald N. Kostoff

Office of Naval Research, 875 N. Randolph St, .Arlington, VA  22217 USA

Dr. J. Antonio del Río; Héctor D. Cortés

Centro de Investigación en Energía, UNAM, Temixco, Mor. México

Charles Smith

Booz-Allen Hamilton, Bethesda, MD 20852

Andrew Smith

University of Queensland, Queensland, Australia

Caroline Wagner; Loet Leydesdorff

University of Ámsterdam, Amsterdam, The Netherlands

George Karypis

University of Minnesota, Minneapolis, MN  55455

Guido Malpohl

University of Karlsruhe, Postfach 6980, 76128 Karlsruhe, Germany

Rene Tshiteya

DDL-OMNI Engineering, LLC, 8260 Greensboro Drive, Suite 600,  McLean, VA 22102

Correspondence to: Dr. Ronald N. Kostoff, Office of Naval Research, 875 N. Randolph St., Arlington, VA  22217; kostofr@onr.navy.mil

Abstract

The technical structure of the Mexican science and technology literature was determined.  A representative database of technical articles was extracted from the Science Citation Index for the year 2002, with each article containing at least one author with a Mexican address.  Many different manual and statistical clustering methods were used to identify the structure of the technical literature (especially the science and technology core competencies), and to evaluate the strengths and weaknesses of each technique.  Each method is summarized, and its results presented.

Keywords: Mexico; Science and Technology; Bibliometrics; Computational Linguistics; Core Competencies; Research Evaluation; Factor Analysis; Concept Clustering; Document Clustering; Data Compression; Network Analysis; Leximancer; CLUTO; Greedy String Tiling

1.       Background and Research Objectives

1.1.     Country Technology Assessments

National science and technology (S&T) core competencies represent a country’s strategic capabilities in S&T.  Knowledge of country core competencies is important for myriad reasons:

1.     Priority technical areas for joint commercial or military ventures

2.     Assessment of a country’s military potential

3.     Knowledge of emerging areas to avoid commercial or military surprise

Obtaining such global technical awareness, especially from the literature, is difficult for multiple reasons:

1.     Much science and technology performed is not documented

2.     Much documented science and technology is not widely available

3.     Much available documented science and technology is expensive and difficult to acquire

4.     Few credible techniques exist for extracting useful information from large amounts of science and technology documentation [1]

Most credible country technology assessments are based on a combination of personal visitations to the country of interest, supplemented by copious reading of technology reports from that country.  Such processes tend to be laborious, slow, expensive, and accompanied by large gaps in the knowledge available.  The more credible and complete evaluation processes will focus on selected technologies from a particular country, and provide in-depth analysis.

For the past half century, driven mainly by the Cold War, a large number of country technology assessments were performed [2-14].  The last two decades have seen an expansion in focus to technologies of major economic competitors.  Over the past two decades, some of the most credible of these country technology assessments have come from two organizations: World Technology Evaluation Center (WTEC-Loyola University) and Foreign Applied Sciences Assessment Center (FASAC-SAIC).    In conducting their studies, both of these organizations would gather topical literature from the country of interest, assemble teams of experts in the topical area, have the teams review the literature as well as conduct site visitations, and have the teams brief their findings and write a final report.  The studies performed by these groups remain seminal approaches to country technology assessments.

1.2.     Text Mining Technology Assessments

The first author’s group has been developing text mining approaches to extract useful information from the global science and technology literature for the past decade [15-26].  These studies have typically focused on a technical discipline, and have examined global S&T efforts in this discipline.  It is believed that such approaches, with slight modification, could be adapted to identifying the core S&T competencies in selected countries or regions, including estimation of the relative levels of effort in each of the core technology areas.  It is also believed that coupling of the text mining approach with WTEC and FASAC approaches would amplify the strengths of each approach and reduce the limitations.  The text mining component would be performed initially to identify:

·      Key core competencies and technology thrusts in the country of interest

·      Key interdisciplinary thrusts

·      Approximate levels of efforts in technology-specific competency areas and in interdisciplinary areas

·      Highly productive researchers

·      Highly productive Centers of Excellence, including those not well known

·      Highly cited researchers

Once the key technologies, researchers, and Centers of Excellence had been identified, then site visitation strategies could be developed.  The second phase of the effort would be the actual site visitations.  A key step in this hybrid process would be demonstration of the ability of text mining to identify the targets of interest with reasonable precision in a timely manner at an acceptable cost.  These three driving parameters (performance, time, cost) could be traded-off against each other to provide a balance acceptable and tailored to a variety of potential customers.

1.3.     Research Objectives

Evaluate approaches for identifying the technology core competencies of the Mexican research literature, and for assessing levels of effort/ emphasis in these core competencies.  Include both manual and statistical approaches.  Identify unique capabilities of each approach.  Focus on clustering approaches whose categories will be determined by the data and algorithms, rather than using pre-determined categories.  Include network-based approaches as well, especially for identifying the relationships among categories.  Compare results from the different core competency identification approaches.

2.       Overview of Approaches and Databases Used

2.1.     Overview

Two major types of information are required for a country S&T core competency assessment.  One is technical infrastructure, which encompasses the prolific performers, journals that contain many of the papers, the prolific institutions, and the most cited papers/ authors/ journals.  The other is technology thrusts, and the relationship among the thrusts.  This study focused on obtaining multiple approaches for identifying the S&T thrusts and their relationships. 

Section 2.2 describes the database used for the taxonomy analyses.  Based on the sampled set of 4529 retrieved papers representing Mexico’s total research, two types of taxonomies are presented, manual and statistical.  The manual taxonomies require mainly hand-classification of Abstracts, journals, and keywords into categories, whereas the statistical approaches use more computer-based pre-classification.  In both approaches, strong human input is required for final categorization.  Section 3 presents the manual taxonomy approaches and results, sections 4-6 present the statistical taxonomy approaches and results, and section 7 presents taxonomy comparisons. 

There are five manual taxonomy results presented (section 3), and three major classes of statistical taxonomy approaches presented (concept clustering (section 4), document clustering (section 5), network mapping (section 6)).  Concept clustering is the grouping of words or phrases based on their co-occurrence in the same text unit.  In the present paper, concept clustering techniques include factor matrix-based clustering and multi-link hierarchical aggregation clustering.    

Document clustering is the grouping of similar documents into thematic categories.  Different approaches exist [29-36].   In document clustering, documents are clustered based on their overall text similarity.  In the present paper, document clustering techniques include Greedy String Tiling (section 5.1), entropy-based data compression (section 5.2), partitional (section 5.3), journal (section 5.4), and latent semantic (section 5.5). 

Network Mapping presents analysis of Mexico’s technology capabilities using network analysis of word co-occurrence to reveal patterns within the data.  These patterns can provide information that would not be evident from a visual examination of the data. 

The reader interested in detailed results on any of the techniques mentioned above should obtain reference [27].

2.2.     Databases and Information Retrieval Approach

For the present study, the Science Citation Index database was used as the record source.  At the time the final data was extracted for the present paper (Fall 2002), the version of the SCI used accessed about 5600 journals (mainly in physical, environmental, engineering, and life sciences basic research).  The retrieved database used for analysis consisted of selected journal records (including the fields of authors, titles, journals, author addresses, author keywords, abstract narratives, and references cited for each paper) obtained by searching the Web version of the SCI for articles that contained at least one author with a Mexico address. 

3.       Manual Taxonomies

Five manual categorization techniques were compared: Article Titles, Journal Titles, Keywords, Full Abstracts, Journals.  Table 1 compares the different manual categorizations of articles into technical disciplines.  If manual categorization of the Full Abstracts is taken as the benchmark, then manual characterization of the Article Titles is the best approximation, and Keyword and Journal Title counts are poorer approximations.

Table 1.  Comparison of Manual Categorization Techniques

Manual Categorization Comparisons

Article

Titles

Journal

Titles

Keywords

Full

Abstracts

Journals

Physics

29.90%

37.50%

26.00%

23.10%

20.40%

Biological and Medical Sciences

33.20%

31%

57.60%

34.70%

39.90%

Chemistry

16.50%

11.90%

10.10%

12.90%

10.30%

Other Topics

7.10%

6.40%

2.90%

10.50%

11.80%

Agriculture

4.70%

3.60%

1.80%

4.90%

3.70%

Mathematical and Computer Science

3.60%

3.60%

0.40%

6.30%

5.30%

Earth Sciences and Oceanography

2.50%

2.60%

0.60%

5.10%

4.70%

Material Science

2.50%

3.50%

0.60%

2.40%

3.80%

4.       Concept Clustering

Two statistically-based concept clustering methods were used to develop taxonomies, factor matrix clustering and multi-link clustering.  Both offer different perspectives on taxonomy category structure from the document clustering approach described later.  None of the clustering approaches included here is inherently superior.

In this section, a synergistic combination of factor matrix and multi-link clustering is described that offers substantial improvement in the quality of the resultant clusters. Once the appropriate factor matrix has been generated, the factor matrix can then be used as a filter to identify the significant technical words for further analysis.  Specifically, the factor matrix can complement a basic trivial word list (e.g., a list containing words that are trivial in almost all contexts, such as ‘a’, ‘the’, ‘of’, ‘and’, ‘or’, etc) to select context-dependent high technical content words for input to a clustering algorithm.  The factor matrix pre-filtering will improve the cohesiveness of clustering by eliminating those words that are trivial words operationally in the application context [28-29].

The remainder of this section presents the multi-link clustering only.  See reference 27 for factor matrix details.

4.1.     Multi-Link Hierarchical Word Clustering

4.1.1  Multi-Link Clustering Approach

A symmetrical co-occurrence matrix of the highest frequency high technical content words/ phrases was generated. The matrix elements were normalized using the Equivalence Index (Eij=Cij^2/Ci*Cj, where Ci is the total occurrence frequency of the ith word/ phrase, and Cj is the total occurrence frequency of the jth word/ phrase, for the matrix element ij), and a multi-link clustering analysis was performed using the WINSTAT statistical package.  The Complete Linkage hierarchical aggregation method was used. A detailed description of the final word dendrogram (a hierarchical tree-like structure), and the aggregation of its branches into a taxonomy of categories, are shown in reference [27].  A summary description now follows.

4.1.2   Multi-Link Word Clustering Results

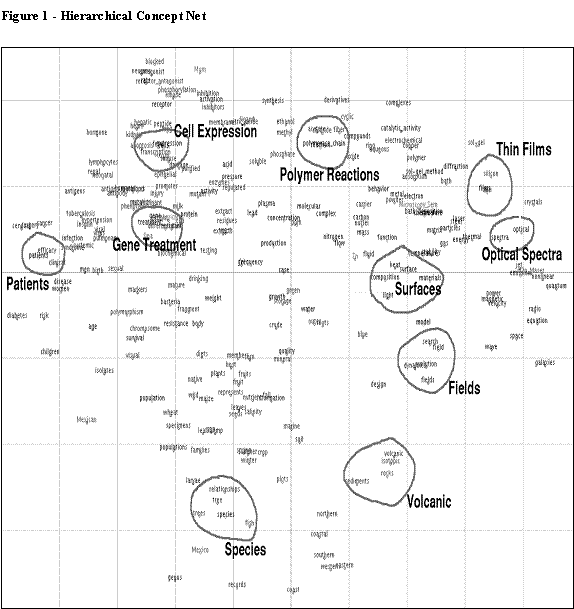
Complete Link clustering was used. The top level clusters form a flat set.  Some of the clusters have a distinct hierarchical structure into sub-clusters, where a technology area can be divided into its specific sub-technologies. 

The 249 words in the dendrogram are grouped into top level clusters. At this level, five broad topics (Categories) can be discerned from visual inspection of the types of words in each cluster.  These include biology, medicine, physics, chemistry, and environment.  Each of these highest level clusters is then divided into smaller clusters by the technical experts, who evaluate the mix of words in each smaller cluster, and then assign a theme to each cluster.

Category 1 - Biology

There are four main groupings: membrane biology/ cell-cell recognition; microbial molecular biology/ gene expression; recombinant DNA biology; plant population genetics.

Category 2 - Medicine

There are five main groupings: cardiopulmonary; reproductive; liver damage; immunology; chronic disease treatment.

Category 3 - Physics

There are four main groupings: quantum and dynamical systems; accelerator physics; solid-state; astrophysics.

Category 4 - Chemistry

There are three main groupings: polymers; molecular characterization; thin films.

Category 5 - Environment

There are four main groupings: forest and agriculture; oceanography and geophysics; heavy metals in sediments; fish growth.

These thematic areas coincide with the major thematic areas listed in Table 1, especially those determined by manual categorization of the full Abstracts.  In Table 1, Agriculture and Earth Sciences and Oceanography were listed as separate themes, whereas the present taxonomy lists them under Environment.

5.       Document Clustering

Document clustering is the grouping of similar documents into thematic categories.  Different approaches exist [30-37].   Five approaches were examined in this paper: Greedy String Tiling, Entropy-based Data Compression, Partitional Clustering, Automatic Journal Categorization, and Latent Semantic Clustering.

5.1.     Greedy String Tiling

5.1.1  Greedy String Tiling Approach

The approach presented in this section is based on a Greedy String Tiling (GST) text matching algorithm [38-39]. Basically, GST clustering forms groups of documents based on the cumulative sum of shared strings of words.  Each group is termed a cluster, and the number of records in each cluster, and the highest frequency technical keywords in each cluster, are two outputs central to this analysis.

5.1.2  Greedy String Tiling Results

A five percent similarity threshold produced a total of 1072 clusters.  Ninety-three percent of the clusters contained eight Abstracts or less.  The 64 largest clusters, (containing 804 Abstracts) were extracted.

The taxonomy defined by the word clustering algorithms was used to categorize the 64 clusters generated by the Greedy String Tiling approach.  Each cluster was assigned to the most appropriate category in the taxonomy defined by the WINSTAT-generated dendrogram of the last section, based on the theme suggested by the highest frequency technical keywords.  The number of records in each taxonomy category from all the clusters in the category was calculated, and is shown in Table 2.


Table 2.  Assignment of GST Clusters to Categories

Cluster Number

Biology

Medicine

Physics

Chemistry

Environment

1


75


2


26

3


25


4


19


5


17


6


17


7


16


8


16


9


15


10


15


11


15


12


13


13


13


14

13


15


13

16


12


17


12

18


12


19


12

20


12


21


12


22


11


23


11


24


11


25


11


26


11


27


11


28


11


29


11


30


11


31


11

32


11


33


10


34


10


35


10


36

10


37


10


38


10

39


10


40


10


41


10


42


10


43


10


44


10


45


10


46


10


47


10


48

9


49


9


50


9


51

9


52

9


53

9


54


9


55


9


56


9


57

9


58


9


59


9


60


9

61


9

62


9


63


9

64


9


SUM

68

176

264

185

111

SUM (NORM)

0.08457711

0.21890547

0.32835821

0.2300995

0.1380597

Compared to the full Abstracts results of Table 1, the present GST categorization provides reasonable agreement in Biology and Medicine (30 vs 34%), modest agreement in Physics (23 vs 33%), and poor agreement in Chemistry (13 vs 23%).

5.2.     Data Compression Clustering

5.2.1  Data Compression Clustering Approach

The compression algorithm approach [40] of this section assumes that the entropy of a string can be measured when this string is zipped (compressed). The main idea is that when one compresses two strings sequentially, the compression rate will increase if the second string is similar to the first one, and then the zipped string will have less disorder (entropy) than the previous two strings. The entropy is defined as

A) Entropy = (Length(zip(A+b))-Length(zip(A)) - Length(zip(b+b))+Length(zip(b)) )/ Length(b).

Where A is the patron text, b is the abstract to be analyzed, and zip indicates the zipped function. The fundamental objective is to automate the classification of records into pre-defined categories, such as the DTIC themes. The complete abstract of each record is then compared against the patron text for each pre-determined DTIC theme, and then each record is assigned to an area that provides the best match.

Nineteen patron texts or lexicons for nineteen DTIC themes are defined. With these nineteen DTIC theme dictionaries, the 4529 abstracts are compressed.  Then, using the best compression rate, the corresponding first level categorization theme for each abstract is selected.

Two other variants of the Entropy formula are used:

B)Entropy = (Length(zipL(A+b))-Length(zipL(A))-Length(zipL(b+b))+Length(zipL(b)) )/Length(b).

where zipL indicates a zipping process with the lexicon as parameter. This variant allows shorter calculation time.

C) Entropy = (Length(zipL(L+b))-Length(zipL(L))-Length(zipL(b+b))+Length(zipL(b)) )/ Length(b).

where the difference is that the Lexicon has been used as a patron text. The computational time is reduced on the order of 6 to 3 hours. relative to the A to C Entropy measurement.

5.2.2  Data Compression Clustering Results

Here, it is important to note that with this method it is possible to analyze all Abstracts.

The results for automated classification with relative entropy defined by A), B) C) are given in Tables 3A-C.


Table 3A.  Automated Classification A Formula

Physics

23%

Biological and Medical sciences

32%

Chemistry

8%

Agriculture

8%

Mathematical and Computer sciences

9%

Earth sciences and Oceanography

8%

Material sciences

12%

Table 3B.  Automated Classification B Formula

Physics

16%

Biological and Medical sciences

37%

Chemistry

6%

Agriculture

7%

Mathematical and Computer sciences

11%

Earth sciences and Oceanography

4%

Material sciences

19%

Table 3C.  Automated Classification C Formula

Physics

16%

Biological and Medical sciences

38%

Chemistry

6%

 Agriculture

7%

Mathematical and Computer sciences

11%

Earth sciences and Oceanography

4%

Material sciences

18%

Although there are some differences between these approaches and the manual characterization, all these results are statistically equivalent to the manual using the Chi-squared statistical test.

5.3.     Partitional Clustering

5.3.1  Partitional Clustering Approach

The approach presented in this section is based on a partitional clustering algorithm [41] contained within a software package named CLUTO.  Most of CLUTO’s clustering algorithms treat the clustering problem as an optimization process that seeks to maximize or minimize a particular clustering criterion function defined either globally or locally over the entire clustering solution space.  CLUTO uses a randomized incremental optimization algorithm that is greedy in nature, and has low computational requirements. 

5.3.2  Partitional Clustering Results

In partitional clustering, the number of clusters desired is input, and all documents in the database are included in those clusters.  The 64 clusters were aggregated into a hierarchical taxonomy using a hierarchical tree generated by the CLUTO software.  The taxonomy is shown in Figure 1.  The categories in the taxonomy levels, and the number of documents in each category, are described as follows:

On Figure 1, the columns represent the taxonomy levels.  There are six levels depicted in this taxonomy.  The highest level (two categories) is the first column, and the lowest level shown (approximately 64 levels) is the last column.  The numbers in parentheses represent the number of records assigned to the category.

The first level has two categories: Biomedical and Ecological (2094) and Engineering and Physical Science (2435).  Percentage-wise, this is a split of 46/54%.  In Table 2 (the manual assignment of GST clusters to categories defined by the word clustering approach), combining the Biology, Medicine, and Environment categories is equivalent to the Biomedical and Ecological category in Figure 1, and combining the Physics and Chemistry categories is equivalent to the Engineering and Physical Science category in Figure 1.  In Table 2, the category split of  44/56% compares very favorably with the 46/54% split of Figure 1.  In Table 1, the category split of 45/ 55% for the manual clustering of the full Abstracts compares favorably as well.

In Figure 1, the second taxonomy level is generated by sub-dividing each first level category by two.  Biomedical and Ecological divides into Biomedical (1267) and Ecology (827), while Engineering and Physical Science divides into Materials and Films (893) and Mathematical, Physics, and Astrophysics Modeling (1542). 

Again, comparing Figure 1 with Table 2, Biomedical (from Figure 1) is roughly equivalent to the combination of Biology and Medicine (from Table 2), and Ecology (from Figure 1) is roughly equivalent to Environment (from Table 2).  The term ‘roughly’ is used because sometimes allocation to Biology vs Medicine is not overly clear, or assignment to Biology vs Environment is not overly clear.  The Biomedical/ Ecology ratio from Figure 1 (1.53) compares only modestly well with the (Biology & Medicine)/Environment ratio from Table 2 (2.2).  The definitional uncertainties are reflected in quantitative differences. Inspection of the GST clusters vs their partitional clustering counterparts shows that these quantitative differences represent manual assignment of clusters to categories vs computer assignment of clusters to categories, more than any intrinsic cluster differences.

Further, Materials and Films (from Figure 1) is roughly equal to Chemistry (from Table 2), and Mathematical, Physics, and Astrophysics (from Figure 1) is roughly equal to Physics (from Table 2).  The term ‘roughly’ is used here because sometimes the allocation to Chemistry vs Physics is not overly clear, especially for materials projects, where the physics of materials and the chemistry of materials are sometimes indistinguishable.  The (Materials and Films)/ (Mathematical, Physics, and Astrophysics) ratio from Figure 1 (.58) compares reasonably well with the Chemistry/ Physics ratio from Table 2 (.70).  Also, the (Materials and Films)/ (Mathematical, Physics and Astrophysics) ratio from Figure 1 (.58) compares well with the (Chemistry and Materials Sciences)/ (Physics and Mathematical and Computer Science) ratio of full Abstracts from Table 1 (.52).


Figure 1Partitional Document Clustering Taxonomy

THE STRUCTURE OF MEXICO RESEARCH - 64 CLUSTERS

Biomedical and ecological (2094)

Biomedical (1267)

Microbiology laboratory studies (699)

Proteins, genetics (307)

Protein activity (207)

Calcium channel currents, sperm modulation (45)

Large protein activity (162)

Gene transcripts, sequencing, and expression (100)

Gene transcripts, sequencing, and expression (100)

Laboratory cell experiments, receptors (392)

Cell infections, immunology, mice (193)

DNA analysis of cell cultures (132)

Infection immunology, mice (61)

Receptors, rats (199)

Neuron receptors, rats, sleep induction (114)

Rats, liver, dialysis (85)

Clinical studies (568)

Clinical studies, diseases (269)

Patient congenital syndromes (93)

Patient congenital syndromes (93)

Patient infectious diseases (176)

Patient infectious diseases (176)

Clinical studies, women and children (299)

Insulin and diabetes, women, men (90)

Women, HPV, cervical (41)

Women, insulin, diabetes, obesity, BMI (49)

Children’s health, Mexico City (209)

Children, blood tests, lead, infections (119)

Health, Mexico City, water, radon (90)

Ecology (827)

New species (267)

New species (86)

New species (86)

New species (86)

Mexican ecology species (181)

Species, forest habitation (104)

Species, forest habitation (104)

Species, Mexican fish (77)

Species, Mexican fish (77)

Food population and environment (560)

Sediment, fish abundance, Gulf of California (145)

Sediments, Gulf of California, river water (70)

Sediments, Gulf of California, river water (70)

Seasonal fish abundance (75)

Seasonal fish abundance (75)

Plant and fruit populations (415)

Plant and fruit populations, soils, seeds (227)

Population genetics, wheat genotypes (104)

Plants and fruits, soils, seeds (123)

Growth, diet, food (188)

Food, diet, growth (62)

Grain processing (126)


Engineering and physical science (2435)

Materials and films (893)

Materials structure and chemistry (736)

Complex compound structure (246)

Compound structure complexes, NMR (155)

Compound structure, NMR (88)

Crystal complexes structure (67)

Atomic bond structure  calculations (91)

Atomic bond structure  calculations (91)

Materials, temperature and phase (490)

Catalytic reactions, metal, oil and asphaltene (234)

Asphaltenes, water absorption (125)

Catalytic reactions, metal electrode oxidation (109)

Temperature, alloy phase (256)

Alloys, phase, temperature composition (155)

Thermal heating, absorption and emission (101)

Thin film deposition (157)

Materials, thin film deposition (112)

Materials, thin film deposition (112)

Materials, thin film deposition (112)

GAA film layer (45)

GAA film layer (45)

GAA film layer (45)

Mathematical, physics, and astrophysics modelling (1542)

Mathematics and physics modelling (1351)

System models (908)

Optical scattering, cross sections, pulsed energy (289)

Optical grating, pulsed laser beam (166)

Neutrino decay, cross sections (123)

System models (619)

Wave, magnetic field, fluid flow, models (362)

System control algorithms (257)

Equations, spaces, algebras (243)

Algebras, spaces, operators (173)

Spaces, proofs, manifold points (98)

Algebras, operators, polynomials (75)

Quantum equations, solutions (270)

Quantum field equations, solutions (200)

Brane inflation, cosmology, scalar fields (70)

Astrophysics (191)

Galactic stars (78)

Galactic stars (78)

Galactic stars (78)

Star emissions, jets (113)

Star emissions, jets (113)

Star emissions, jets (113)


One final comment about Figure 1.  Using 64 clusters allows a reasonable picture to be drawn about broad areas of research.  If detailed program thrusts were desired, however, many more clusters than 64 would be required.  The specific number depends on the degree of focus desired.

From reference [27], the recent Mexico S&T expenditures are on the order of $2.5 Billion/yr.  If 64 clusters are used to categorize this S&T, then each cluster (on average) would cover about $40 Million/yr of S&T expenditure.  This reflects rather broad categories.  If, however, 512 clusters were used, then the resolution increases to about $5 Million/yr for the category average.  This level of resolution would cover small groups of projects.

5.4.     Journal Clustering

In the information provided by ISI there is a register indicating category or categories of the journal. This section utilizes this classification of journals by categories, and papers are associated in accordance with the category in the ISI.

5.4.1  Journal Clustering Approach

The simplest form of clustering the journals is to use the register provided by ISI. However, the criteria used by ISI in the classification are not in agreement with the DTIC taxonomy and there are several hundred categories. For this reason, we group the categories provided by ISI manually with the goal of obtaining a classification as close as possible to that of DTIC, and then we count the number of papers with the register in the ISI. Thus, the use of ISI classification provides useful information, as can be seen in the results.


5.4.2  Journal Clustering Results

Table 4 presents the results of the automated classification.

Table 4.  Automated Classification According to ISI


CATEGORY

NUMBER

FRACTION

Astronomy

217

0.046229

Atmosphere

45

0.009587

Behavior

96

0.020452

Biology

1825

0.388794

Computer

63

0.013421

Chemistry

464

0.09885

Electronics

117

0.024925

Energy

63

0.013421

Engineering

101

0.021517

Environmental

170

0.036216

Geosciences

105

0.022369

Materials

276

0.058798

Mathematics

157

0.033447

Mechanics

30

0.006391

Multidisciplinary

32

0.006817

Ocean

92

0.019599

Physics

819

0.174478

Radiation

22

0.004687


These results seem to be in agreement with the manual classification according with DTIC, at least in names.  Please note that there are some papers appearing in two or more categories, because ISI gives this possibility. However, these cases are less than the 5% of the total sample.

5.5.     Self-Organising Named Concept Extraction and Clustering (Latent Semantic)

5.5.1  Concept Extraction and Clustering Approach

This approach to concept extraction and clustering employs a Bayesian analysis of word co-occurrences, but one that includes nonlinear machine learning algorithms. The method passes through four stages of processing. The first stage involves the seeding of named concepts via extraction of seed terms from the text which possess particular statistical characteristics. The second stage learns a family of related terms around each seeded concept by means of an iterative optimiser with feedback. The result of the first two stages is referred to as a thesaurus, since it bears some resemblance to the thesauri used in Information Science applications. At this stage, the thesaurus has no hierarchy – it is flat. In the third stage, the thesaurus is used to classify the text at a 2-sentence resolution. The tagging of each two sentence segment with multiple concepts generates a directed network of concept co-occurrences. The final stage treats the network of concept co-occurrences as a complex system in order to extract emergent thematic groupings of concepts. This stage results in an interactive visualisation of the concept network. For non-interactive publication, the spatial proximity of clustered concepts and the connectedness of each concept is used to generate a ranked recursive schedule of concept groups. At the lowest level, each concept is described by the lexical term list from the thesaurus.

More details of the method are given in Reference [42].

5.5.2  Concept Extraction and Clustering Results

Table 5 contains some examples of thesaurus entries (not in strict rank order), which form the lowest level of the hierarchy:

Table 5.  Concepts and their Related Lexical Terms

Concept

Lexical Terms

Cells

cells Trh internalization Cx43 cell Sertoli transfected macrophage Sf9 lymphocyte germinal dendritic proliferate cancers monocytic

Species

species helminths Monstrilla subgenus Atlantic_ocean monstrilloid Coreidae Hemiptera tribe synonym Cercidium digenean Qpf niche greggii

Surface

surface plasmon adsorbed passivation broadening Bet pacificus higher-mode probing Fvc radiometry wafer 4x2 acetylene scribeline

Films

films thin Cds spray sputtering ellipsometry foils Cdo Cbd Films as-deposited co-sputtering F-7 filamentous Sb2s3-cus

Acid

acid acetic lactic bell linoleic nucleic uric arachidonic lysophosphatidic demineralization niflumic glutamic aminolevulinic Taurine retinoic

Gene

gene encodes encoded Streptomyces reporter undetectable exons di-rhamnolipid Drd4 Recr Rhlc St ichthyosis Ais rhamnosyltransferase

Quantum

quantum dots dilatonic Thomas-fermi exciton undetected excitons reflectometry spins mechanics worlds billiard inter-band polarization-modulation rigorously


After classification of the data using the thesaurus, and subsequent emergent clustering, a hierarchical concept net was obtained. An annotated screen shot of this, taken from the interactive browser, is shown in Figure 2.

For the purposes of non-interactive publication, this 2D clustering of the hierarchical network is then serialised into a ranked recursive list of thematic concept groups. Some of these are listed in Table 6 below (not in strict rank order). The interactive version of the full network is currently available from <http://www.leximancer.com/documents/mexico_report/report.html>.


Finally, it should be noted that this approach naturally results in automatic classification of the text. This classification system can be used to explore the collection.


Table 6.  Thematic Concept Groups.


Group Name

Child Groups & Leaf Concepts

CELLS

cells protein expression treatment gene human blood receptor damage Dna coli Escherichia antibody apoptosis heart recombinant fetal mouse resistant epithelial mutations hepatic mutant milk purified toxin antigen injury promoter biochemical peptide lung assays differentiation phenotype mutation transcription kidney expressing inhibit gland peripheral mitochondrial epithelial_cells regulatory mild actions disorder apoptotic potent saline participation protection organs subunit peripheral_blood initiation pathogenic cells_expressing Western_Blotting

SURFACE

surface electron materials chemical bath_deposition composition behavior sol-gel_method gas particles metal matrix laser stability heat Microscopy_Sem adsorption powder polymer bath steel alloy aluminum coatings electrode oxides Sem eta reactor silica reversible Pb Ti ionization chains tau Uv loop microscopic Ftir Cr decomposition surface_tension crude_oil

PATIENT

patients disease infection women clinical risk insulin cancer virus men syndrome tuberculosis hypertension cervical antigens birth pulmonary viral surgery efficacy systemic surgical parasite men_women oral care diabetes_mellitus cervical_cancer hospital cardiac birth_weight mycobacterium_tuberculosis systemic_lupus divided_groups multivariate_analysis intestinal_metaplasia pulmonary_tuberculosis patients_underwent

OPTICAL

optical emission spectra thermal magnetic H2o_Maser velocity nonlinear power jet radio transverse excited disk Gaas transitions charged tension photon detector formula oscillations mechanics neutron transverse_momentum quantum_wells excited_states phase_transitions porous_media

PLANTS

plants body host fruit leaves wild diets corn shrimp maize native spp members salinity seeds fruits leaf represents germination nutrient comparative recovered juvenile nutritional winter_spring white difficult spring_summer segment requirements eggs head crude_protein similarity movement majority superior date white_shrimp

SPECIES

species Mexico larvae genus fish tree relationships records trees habitat vegetation seasons genera larval forests

SPACE

space galaxies wave radio scalar disk gravity compact dual algebra metric formula black_holes matrices expressions scalar_field quantum_wells

6.       Network Mapping of Word Co-Occurrence

This section discusses the data sources and methods, the use of network analysis, and the results of the analysis.

6.1.     Approach

6.1.1  Data sources

The materials consist of the titles and abstracts of 4,529 documents collected from various sources on the selection criterion of an institutional address in Mexico. Abstracts and titles are studied separately. The titles contain 10,956 words that occur in total 40,852 times.  The abstracts contain 31,724 unique words that occur in total 482,922 times. 

The title words are packed more densely than the abstract words. Note that the ratio is 40,852/10,956  =  3.73 for title words and 481,922/31,724 =  15.18 for abstract words. This accords with previous research in which it was shown that abstract words are less codified than title words [43].   Sentences indicating copyright issues were removed from the abstracts. The stopword list available at http://www.uspto.gov/patft/help/stopword.htm was used as a corrective to the inclusion of common words. Otherwise, the words were corrected only for the plural ‘s.’

6.1.2  Analysis

An analysis of the data shows that 100 abstract words occur more then 500 times, and that 108 title words occur more then 40 times. In both cases, an asymmetrical matrix was constructed containing the 4,592 documents as the cases and the respective word set as the variables. From this matrix a symmetrical matrix of co-occurrences among the words is generated and a second symmetrical matrix is constructed based on the cosine as a similarity criterion between the words as variables [44-48].

The symmetrical matrices are analyzed using Pajek [49].  The asymmetrical ones are factor analyzed using SPSS (Varimax rotation and Kaiser normalization). Figure 3 provides an example of a co-occurrence map (of abstract words) and Figure 4 an example of a vector-space model based on the cosine matrix using title words.

6.2.     Results

6.2.1  Abstracts

Sixty-three among the 100 abstract words used co-occur more than 500 times. These are depicted in Figure 3. They form a star shaped network with some interconnecting hubs.  The words “effect” and “result” function as hubs and represent the methodologies and their outputs; thus, these results are not highly indicative of capacity. Other words that act as hubs may be more indicative of capacity, including “cell,” “patient,” and “model.”  In particular, cell and patient may be aligned with biomedical or biotechnology research.

Figure 3 Co-occurrence map of 63 abstract words co-occurring more than 500 times

Normalization of the word occurrences using the cosine as a similarity criterion does not change this picture qualitatively, although some of the stronger relations are highlighted because the star shape is less pronounced in the vector-space model. 

6.2.2  Title Words

Among the 108 title words that occur more than 40 times in the set, 53 words co-occur more than ten times.  Seventy-five words are included in the vector-space model if the threshold for the cosine is set at ≥  0.1. This results in an informative picture (Figure 4).


The map shows that several grouping in the data can be distinguished.  The clusters appear to bolster the suggestion drawn from mapping the co-occurrences among title words (not shown here) that there are capacities in biomedicine, biotechnology, materials science, and possibly chemistry.  These can be further refined to show the possibility of a specialty in materials related to semiconductors (E1 and E2), biotechnology related to genetic expression within human cells (F), and chemical synthesis at the molecular level—nanotechnology?—(G1 and possibly G2).

In addition, this level of analysis suggests several capacities that are not revealed in any other figure.  These include a cluster (H) which may suggest capacity in physics and/or astronomy.  The cluster revealed in (J) suggests capacities related to semiconductors, polymers and/or geophysics.  The cluster (K) also shows a co-occurrence among the words related to optical research, possibly indicating capacities in lasers or other optical research.

6.2.3  Observations on Network Mapping Results

The data is weakly codified. This is a consequence of the selection criterion of the retrieval (i.e., an address in Mexico). Different lines of research are drawn into the set and the set is therefore very heterogeneous. Small groups of co-occurring words can be distinguished in the set of title words, but the abstract words are mainly tied together because of the words related to the word “results.”

The structure in the title words can be appreciated as intellectually meaningful despite of the weak structure in the network among the words.  Analysis of the title words is in some ways more suggestive than the abstract words. The vector-space model of the title words suggests certain capacities within Mexican technology relating to biotechnology, biomedicine, materials research, chemistry, and physics.  This can be checked against overall publications records and citations, which suggest Mexican strength in physics and chemistry [50].

7.       Taxonomy Comparisons

Three generic approaches to taxonomy construction were presented: manual clustering, statistical concept clustering, statistical document clustering.  The manual clustering of Abstracts was used as the benchmark, and was approximated most closely in the manual group by manual clustering of titles.

The concept clustering approaches (factor matrix, multi-link word/ phrase, self-organizing concept extraction, network analysis) provided complementary perspectives, and all identified the major thrust areas.  The document clustering approaches (Greedy String Tiling, Partitional Clustering, Data Compression, Journal Clustering) showed reasonable agreement among each other, and with the manual Abstract clustering (See Table 7 below).  The main differences appear to be among Biomed, Chemistry/ Materials, and Environment.  Chemical reactions and biological organisms play a role in all three literatures, and slight differences in similarity determination could result in transference of documents among these three clusters.


Table 7.  Technical Catgory vs Document Clustering Technique

(matrix elements in percentages)

TAXONOMY

BIOMED

PHYSMATH

CHEMAT'LS

ENVIRONMENT

GST

30.4

32.8

23

13.8

CLUTO

28

34

19.8

18.3

DATACOMP A

32

32

20

18

DATACOMP B

37

27

25

11

DATACOMP C

38

27

24

11

JOURNALS

41

34

16

9

MANUAL

38.6

32.7

17

11.1

8.       Summary and Conclusions

The main objective of this study was to identify and assess the technical core competencies of Mexico.  This was accomplished using a variety of manual and statistical clustering approaches.  There appear to be four major technical core competencies: Biomedical Sciences includes about 35% of Mexican research; Physics/ Mathematics includes about 30%; Chemistry/ Material Sciences covers about 15%; and Environmental Sciences includes about 10%.  The remaining 10% of Mexican research is allocated to myriad other research topics.

If manual clustering is to be used for taxonomy development, the full Abstract is preferable.  If the full Abstract is not available, manual clustering of titles is an acceptable alternative.

The different concept clustering approaches provided complementary perspectives.  The factor matrix approach provided good intra-theme word/ phrase quantification linkages, while the network-based approaches provided excellent maps of related concepts.

The document clustering approaches provided reasonable agreement among each other and the benchmark manual Abstract clustering.  All the document clustering approaches need improvement in handling multi-theme documents and eliminating low technical content words/ phrases. 

For multi-theme documents some type of fuzzy clustering [51] will be required, where a document can be allocated fractionally to different clusters.  The CLUTO partitional clustering algorithm is presently being upgraded to incorporate fuzzy clustering.  Elimination of low technical content words/ phrases can be done manually and/ or statistically.  The manual approach involves creation of larger stop word lists.  This is a laborious process, and has an intrinsic deficiency.  The judgment of whether a word/ phrase has high or low technical content is context-dependent, and accurate word/ phrase characterizations require context-dependency as part of the selection algorithm.  Various statistical approaches have been proposed for context-dependent stop word selection [52, 53].  In the present study, none of the document clustering techniques used a statistical approach for stop word removal, but the multi-link word/ phrase clustering approach used a unique quasi-statistical approach [54].  Improved elimination of low technical content words/ phrases is mandatory for clustering accuracy gains.

Finally, another clustering accuracy limitation which all the concept clustering and most of the document clustering approaches did not address was the treatment of related concepts that used different terminology.  Most of the clustering approaches examined here used text matching for generating cluster similarity.  To overcome this limitation, some type of thesaurus needs to be employed to standardize terminology and/ or some form of latent semantic approach is required.

The Greedy String Tiling was developed, and is an excellent tool, for detecting plagiarism based on similarity of long text sections.  Much of its powerful capability goes unused in the present document clustering application, since it would be rare for non-plagiarized text to contain identical long text strings, and the algorithm operationally ends up comparing word or short phrase similarities.  Running times are very long for the clustering application.

The network mapping approaches appear to have strength in determining technical thrust relationships, and offer a complementary perspective to the phrase/ document clustering approaches.

The clustering appears useful for generating the structure of a country’s S&T.  Continual upgrades in the clustering algorithms insure that the accuracy of the clusters and categories will continue to improve.

9.       Acknowledgements

The component of work on this paper conducted in Mexico has been partially supported by CONACyT-FOMIX 9250.

(The views in this paper are solely those of the authors, and do not necessarily represent the views of the Department of the Navy or any of its components, the UNAM, Booz-Allen Hamilton, DDL-OMNI, the University of Queensland, the University of Amsterdam, the University of Karlsruhe, or the University of Minnesota.)

10.    References

[1]    R.N. Kostoff, Text Mining for Global Technology Watch.  In: M. Drake (ed.), Encyclopedia of Library and Information Science,  Second Edition.    (Marcel Dekker, Inc.  New York, NY.  2003. Vol. 4.  2789-2799).

[2]    C.W. Bostian, W.T. Brandon, A.U. MacRae, C.E. Mahle, S.A. Townes,  Key technology trends - Satellite systems,  Space Communications  16 (2-3) (2000) 97-124.

[3]    B. Leneman,  Automation in Soviet Industry, 1970-1983 - An Assessment of the Present State of Robot-Technology,  Revue D Etudes Comparatives Est-Ouest  15 (1) (1984) 75-112.

[4]    P. Stares, United-States and Soviet Military Space Programs - A Comparative-Assessment,  Daedalus  114 (2) (1985) 127-145.

[5]    R.C.W. Hutubessy, P. Hanvoravongchai, T.T.T. Edejer,   Diffusion and utilization of magnetic resonance imaging in Asia,  International Journal of Technology Assessment in Health Care  18 (3) (2002) 690-704.

[6]    B. Mooney, R. Seymour,  WTEC panels survey Russian maritime technologies,  Marine Technology Society Journal  30 (1) (1996) 71-72.

[7]    L.V. McIntire, WTEC panel report on tissue engineering (Reprinted),  Tissue Engineering  9 (1) (2003) 3-7.

[8]    Robert Campbell, H.D. Balzer, J. Berliner, R. Dobson, and P. Gregory, Soviet Science and Technology, Foreign Applied Sciences Assessment Center (October 15, 1985).

[9]    A. Klinger, editor, Soviet Image Pattern Recognition Research,  Foreign Applied Sciences Assessment Center, Science Applications International Corp., 10260 Campus Point Drive, San Diego, CA 92121, and 1710 Goodridge Drive, McLean VA 22102 (January 1990).

[10] R.M. Gray (Ed.), M. Cohn, L.W. Craver, A. Gersho, T. Lookabaugh, F. Pollara, and M. Vetterli, Non-US Data Compression and Coding Research,  A Foreign Applied Sciences Assessment Center (FASAC) report prepared for Science Applications International Corporation (SAIC) under U.S. Government sponsorship (November 1993).

[11] L. J. Lanzerotti, R. C. Henry, H. P. Klein, H. Masursky, G. A. Paulikas, F. L. Scarf, G. A. Soffen, and Y. Terzian, Soviet Space Science Research, FASAC Technical Assessment Report FASAC-TAR-3060, Foreign Applied Sciences Assessment Center (1986).

[12] L.M. Duncan, F.T. Djuth, J.A. Fejer, N.C. Gerson, t. Hagfors, D.B. Newman, Jr., R.L. Showen, Soviet Ionospheric Modification Research, Foreign Applied Sciences Assessment Center, Technical Assessment Report 4040 (1988).

[13] W.J. Spencer, J.Y. Chen, A. Chiang, W. Frieman, E.S. Kuh, J.L. Moll, R.F. Pease, and K.C. Saraswat, Chinese Microelectronics, Foreign Applied Sciences Assessment Center Technical Assessment Report, Science Applications International Corporation (April 1989).

[14] R.C. Davidson, M.A. Abdou, L.A. Berry, C.W. Horton, J.F. Lyon, and P.H. Rutherford, Japanese Magnetic Confinement Fusion Research, Foreign Applied Sciences Assessment Center Technical Assessment Report, Science Applications International Corporation (1990).

[15] R.N. Kostoff, H.J. Eberhart, D.R. Toothman, and R. Pellenbarg,   Database Tomography for Technical Intelligence: Comparative Analysis of the Research Impact Assessment Literature and the Journal of the American Chemical Society,  Scientometrics 40(1) (1997) 103-138.

[16] R.N. Kostoff, H.J. Eberhart,and D.R. Toothman, Database Tomography for Technical Intelligence: A Roadmap of the Near-Earth Space Science and Technology Literature,  Information Processing and Management  34(1) (1998)  69-85.

[17] R.N. Kostoff, H.J. Eberhart, and D.R. Toothman, Hypersonic and Supersonic Flow Roadmaps Using Bibliometrics and Database Tomography,  Journal of the American Society for Information Science  50(5) (1999) 427-447.

[18] R.N. Kostoff, T. Braun, A. Schubert, D.R. Toothman, and J.A. Humenik, Fullerene Roadmaps Using Bibliometrics and Database Tomography, Journal of Chemical Information and Computer Science   40(1) (2000) 19-39.

[19] R.N. Kostoff, K.A. Green, D.R. Toothman, and J.A. Humenik,  Database Tomography Applied to an Aircraft Science and Technology Investment Strategy,  Journal of Aircraft 37(4) 2000 727-730.

[20] R.N. Kostoff, and R.A. DeMarco,  Science and Technology Text Mining,  Analytical Chemistry  73(13) (2001) 370-378A.

[21] R.N. Kostoff, J.A. Del Rio, E.O. García, A.M. Ramírez, and J.A. Humenik, Citation Mining: Integrating Text Mining and Bibliometrics for Research User Profiling, JASIST  52(13) (2001) 1148-1156.

[22] R.N. Kostoff, R. Tshiteya, K.M. Pfeil, and J.A. Humenik,  Electrochemical Power Source Roadmaps using Bibliometrics and Database Tomography,   Journal of Power Sources  110(1) (2002) 163-176.

[23]  R.N. Kostoff, M.F. Shlesinger, and G. Malpohl, Fractals Roadmaps using Bibliometrics and Database Tomography,  Fractals  12(1) (2004) 1-16.

[24] R.N. Kostoff, M.F. Shlesinger, and R. Tshiteya, Nonlinear Dynamics Roadmaps using Bibliometrics and Database Tomography,  International Journal of Bifurcation and Chaos,  14(1) (2004)  61-92.

[25] R.N. Kostoff, C.W. Bedford, J.A. Del Rio, H. Cortes, and G. Karypis,  Macromolecule Mass Spectrometry: Citation Mining of User Documents,  Journal of the American Society for Mass Spectrometry,  15(3) (2004) 281-287.

[26] R.N. Kostoff, G. Karpouzian, and G. Malpohl, Text Mining the Global Abrupt Wing Stall Literature, Journal of Aircraft  42(3) (2005) 661-664. 

[27] R.N. Kostoff, J.A. Del Rio, H.D. Cortes, C. Smith, A. Smith, C.S. Wagner, L. Leydesdorff, G. Karypis, G. Malpohl, and R. Tshiteya,  Science and Technology Text Mining: Mexico Core Competencies.  DTIC ADA Number 430724.


[28] R.N. Kostoff,  The Practice and Malpractice of Stemming,  JASIST  54(10) (2003) 984-985.

[29] R.N. Kostoff, J.A. and Block, Factor Matrix Text Filtering and Clustering, JASIST 56(9) (2005) 946-968.

[30] D.R. Cutting, D.R. Karger, J.O. Pedersen, J.W. Tukey,  Scatter/Gather: A cluster-based approach to browsing large document collections. In Proceedings of the 15th International ACM SIGIR Conference on Research and Development in Information Retrieval (SIGIR'92).  (1992) 318-329.

[31] S. Guha, R. Rastogi, K. Shim,  CURE: An efficient clustering algorithm for large databases,  In Proceedings of the ACM-SIGMOD 1998 International Conference on Management of Data (SIGMOD’98) (1998)  73-84.

[32] M.A. Hearst,  The use of categories and clusters in information access interfaces,  In T. Strzalkowski (ed.), Natural Language Information Retrieval  (Kluwer Academic Publishers. 2000).

[33] G. Karypis, E.H. Han, V. Kumar,  Chameleon: A hierarchical clustering algorithm using dynamic modeling, IEEE Computer: Special Issue on Data Analysis and Mining 32(8) (1999) 68-75.

[34] E. Rasmussen, Clustering Algorithms.  In: W. B. Frakes and R. Baeza-Yates (eds.).   Information Retrieval Data Structures and Algorithms   (Prentice Hall, N. J.) (1992).

[35] M. Steinbach, G. Karypis, V. Kumar,  A comparison of document clustering techniques,  Technical Report #00--034. 2000.  Department of Computer Science and Engineering.  University of Minnesota (2000).

[36] P. Willet, Recent trends in hierarchical document clustering: A critical review, Information Processing and Management 24 (1988) 577-597.

[37] O. Zamir, O. Etzioni,  Web document clustering: A feasibility demonstration. In: Proceedings of the 19th International ACM SIGIR Conference on Research and Development in Information Retrieval (SIGIR'98)  (1998) 46-54.

[38] L. Prechelt, G. Malpohl, M. Philippsen,  Finding plagiarisms among a set of programs with JPlag, Journal of Universal Computer Science 8(11)  (2002) 1016-1038.

[39]  M.J. Wise, Neweyes: a system for comparing biological sequences using the running Karp-Rabin Greedy String-Tiling algorithm.  Proc Int Conf Intell Syst Mol Biol. 1995;3:393-401.

[40] D. Benedetto, E. Caglioti, V. Loreto, Language trees and zipping, Physical Review Letters 88(4) (2002) Art. No. 048702.

[41] G. Karypis,  CLUTO—A clustering toolkit, http://www.cs.umn.edu/˜cluto (2005).

[42]  A.E. Smith,  M.S. Humphreys. Evaluation of unsupervised semantic mapping of natural language with Leximancer concept mapping.  Behavior Research Methods.  In Press.

[43] L. Leydesdorff, Words and Co-Words as Indicators of Intellectual Organization, Research Policy 18 (4) (1989) 209-223.

[44] P. Ahlgren, B. Jarneving, and R. Rousseau, Requirement for a Cocitation Similarity Measure, with Special Reference to Pearson’s Correlation Coefficient, Journal of the American Society for Information Science and Technology 54 (6) (2003) 550-560.

[45] C.S. Wagner, and L. Leydesdorff. (forthcoming). Mapping Global Science using International Co-Authorships: A Comparison of 1990 and 2000. International Journal of Technology and Globalization (In Press)

[46] J.L. Ortega Priego, A Vector Space Model as a Methodological Approach to the Triple Helix Dimensionality: A Comparative Study of Biology and Biomedicine Centres of Two European National Councils from a Webometric View, Scientometrics, 58 (2) (2003) 429-443.

[47] G. Salton, and M. J. McGill, Introduction to Modern Information Retrieval. (Auckland, etc.: McGraw-Hill, 1983).

[48] H.D. White, Author Cocitation Analysis and Pearson’s r,  Journal of the American Society for Information Science and Technology 54 (13) (2003) 1250-1259.

[49]  V. Batagelj, A. Mrvar, Pajek - Program for Large Network Analysis. Home page   http://vlado.fmf.uni-lj.si/pub/networks/pajek/  (Accessed 14 December 2005)

[50] C.S. Wagner, and S. Popper, Technology Use and Productivity in Mexico, RAND Europe, Final Report, 2002.

 [51]  M.P. Windham, Cluster Validity for Fuzzy Clustering Algorithms,  Fuzzy Sets and Systems 5 (2): (1981) 177-185.

[52]  W.J.Wilbur, K. Sirotkin,  The automatic identification of stop words.  Journal of Information Science.  18 (1).  (1992) 45-55.

[53] A. Bookstein, S.T. Klein, T. Raita,   Clumping properties of content-bearing words.  Journal of the American Society for Information Science.  49 (2).  (1998). 102-114. 

[54]  R.N. Kostoff, J.A. Block.  Factor Matrix Text Filtering and Clustering.  JASIST.  56:9. (2005) 946-968.


return