return
A Global Map of Science Based on the ISI Subject Categories
Loet Leydesdorff
& Ismael Rafols
 <click here for pdf>
Abstract
The ISI subject categories classify journals included in the
Science Citation Index (SCI). The aggregated journal-journal citation
matrix contained in the Journal Citation Reports can be aggregated on
the basis of these categories. This leads to an asymmetrical transaction matrix
(citing versus cited) which is much more densely populated than the underlying
matrix at the journal level. Exploratory factor analysis leads us to opt for a
fourteen-factor solution. This solution can easily be interpreted as the
disciplinary structure of science. The nested maps of science (corresponding to
14 factors, 172 categories, and 6,164 journals) are brought online at http://www.leydesdorff.net/map06/index.htm. An
analysis of interdisciplinary relations is pursued at three levels of
aggregation using the newly added ISI subject category of “Nanoscience &
nanotechnology.” The journal level provides the finer grained perspective. Errors
in the attribution of journals to the ISI subject categories are averaged out
so that the factor analysis can reveal the main structures. The mapping of
science can, therefore, be comprehensive at the level of ISI subject categories.
Keywords: journal, science, map, classification,
interdisciplinarity, visualization
Introduction
The decomposition of the Science Citation Index into
disciplinary and subdisciplinary structures has fascinated scientometricians and
information analysts ever since the very beginning of this index. Price (1965)
conjectured that the database would contain the very structure of science. He
suggested that journals would be the appropriate units of analysis, and that
aggregated citation relations among journals might reveal the disciplinary and
finer-grained delineations such as those among specialties.
Carpenter & Narin (1973) tried to cluster the database
in terms of aggregated journal citation patterns using the methods available at
the time. However, the size of the database—2,200 journals in 1969 (Garfield,
1972: 472) and 6,164 journals in 2006—made it difficult to use algorithms more
sophisticated than single-linkage clustering. Single-linkage clustering can
operate on rank orders in lists, and thus one did not have to load these relatively
large matrices into memory.
Small & Sweeney (1985) added a variable threshold to
single-linkage clustering in their effort to map the sciences globally using
co-citation analysis at the document level. However, the choice of thresholds, similarity
criteria, and the clustering algorithms remained somewhat arbitrary. Because of
the focus on relations, the latent dimensions of the matrix (its so-called
“eigenvectors”) could not be revealed using single-linkage clustering
(Leydesdorff, 1987). A structural approach requires multivariate analysis, for
example, based on rotation of the initial factor solution: units of analysis
may occupy similar positions without necessarily maintaining strong relations
(Burt, 1982; Leydesdorff, 2006).
The factor-analytical approach is limited even today to
approximately 3,000 variables using the latest version of SPSS, while in the
meantime the database has grown to more than 6,000 journals (Leydesdorff, 2006).
Most researchers have therefore focused on chunks of the database or used seed
journals for the collection of a sample (Doreian & Farraro, 1985; Tijssen et
al., 1986; Leydesdorff, 1986). Boyack et al. (2005) used the VxInsight
algorithm (Davidson et al., 1998) in order to map the whole journal structure
as a representation of the structure of science.
However, the journal set remains fuzzy (Bensman, 2001) and therefore delineations
are still based necessarily on trade-offs between accuracy, readability, and
simplicity (Boyack et al., 2007). Klavans & Boyack (2007: 438) noted
that a journal may occupy a different position in a different context.
Leydesdorff (2007a) drew the conclusion that the point of entry remains crucial
to the construction of a reference set, and therefore the database could be
made accessible from any user’s perspective with equal validity.
In addition to journals, the database has been mapped using
co-citations (Small, 1973; Small & Griffith, 1974; Small & Sweeney,
1985) or co-occurrences of title words (Callon et al., 1983; 1986;
Leydesdorff, 1989), at various levels of aggregation. However, using lower-level units (like documents) instead of journals means abandoning Price’s grandiose
vision to map the whole of science using the structure present in the
aggregated journal-journal (co)citation matrix. The presence of a structure is indicated
by the many zeros and missing values in this citation matrix. In 2006, for
example, the database contained only 1,201,562 of the 37,994,896 (= 6,1642)
possible relations. This corresponds to a density of 3.16%.
Since relations are dense in discipline-specific clusters and
otherwise virtually non-existent, this matrix can be considered as nearly-decomposable.
Near-decomposability is a general property of complex and evolving systems
(Simon, 1973). The next-order units (e.g., disciplines or specialties) are
reproduced in relatively stable sets which may change over time. The sets are
functional subsystems that show a high density in terms of relations within the
center, but are more open to change at the margins. (They can also become
unstable.) The decomposition of such nearly-decomposable sets is analytically
imprecise, but reasoned assumptions may nevertheless make it feasible (Newman,
2006a; 2006b).
ISI Subject Categories
Hitherto, assumptions about components and clusters have
been made mainly on formal grounds. How can one cluster the database bottom-up?
However, the Institute of Scientific Information (ISI) has added a substantive classifier
to the database: the subject category or subject categories of each journal
included. These categories are assigned by the ISI staff on the basis of a
number of criteria including the journal’s title, its citation patterns, etc.
(McVeigh, personal communication, 9 March 2006).
The subject categories of the ISI cannot be considered as based
on “literary warrant” like the classification of the Library of Congress (Chan,
1999). A classification scheme based on literary warrant is inductively
developed in reference to the holdings of a particular library, or to what is
or has been published. In other words, it is based on what the actual
literature of the time warrants. For example, each of the individual
schedules in the classification of the Library of Congress (LC) was initially
drafted by subject specialists, who consulted bibliographies, treatises,
comprehensive histories, and existing classification schemes to determine the
scope and content of an individual class and its subclasses. The LC has a
policy of continuous revision to take current literary warrant into account, so
that new areas are developed and obsolete elements are removed or revised. The
ISI categories are changed in terms of respective coverage, but cannot be
revised from the perspective of hindsight.
In order to enhance flexibility in the database, the Science
Citation Index is organized with a CD-Rom version for each year separately
(which is by definition fixed at the date of delivery), and the SCI-Expanded
version at the Internet to which relevant data can be added from the
perspective of hindsight in order to optimize the database for information
retrieval purposes. The Journal Citation Reports, however, are provided
as a separate service of the ISI. The web version of this database is kept in
complete agreement with the yearly CD-Rom. Thus, the subject categories
themselves are not systematically updated, although new categories can be added
and obsolete ones may no longer be used.
In addition to the subject categories, Thomson-ISI also assigns
each journal in the Essential Science Indicators database (12,845
journals) to one of 22 so-called broad fields. (The listing of these
attributions is available at http://www.in-cites.com/journal-list/index.html.)
Journals are uniquely classified to a single broad field, while they can be
classified under different subject categories in the Science Citation Index.
The Essential Science Indicators provides statistics for government
policy makers, university or corporate research administrators, etc., while the
main service of the Science Citation Index is information retrieval for
the research process.
For our research question about science mapping, the 172+
ISI subject categories are more interesting than the 22 broad fields because
they are more finely grained. Leydesdorff (2006: 612) concluded that one cannot
develop a conclusive classification on the basis of analytical arguments.
However, the quality of a proposed classification can be tested against the
structure in the data, in this case, aggregated journal-journal citations.
Glänzel & Schubert (2003), for example, proposed twelve instead of 22 broad
fields, but these categories are again different from the scheme of twelve
categories proposed by Boyack et al. (2005). In this study, we focus on
underlying data in the Science Citation Index, while these other studies
included also the Social Science Citation Index. Given our analytical
objective, the differences in citation behavior between the social sciences and
the natural sciences could disturb the design as another source of variance.
The number of category attributions in the Science Citation
Index is 9,848 for 6,164 journals in 2006 or, in other words, approximately
1.6 category per journal. The coverage of the 172 categories ranges from 262
journals sorted under “Biochemistry and Molecular Biology” to five journals
which are sorted under a single category.
The average number of journals per category is 56.3.
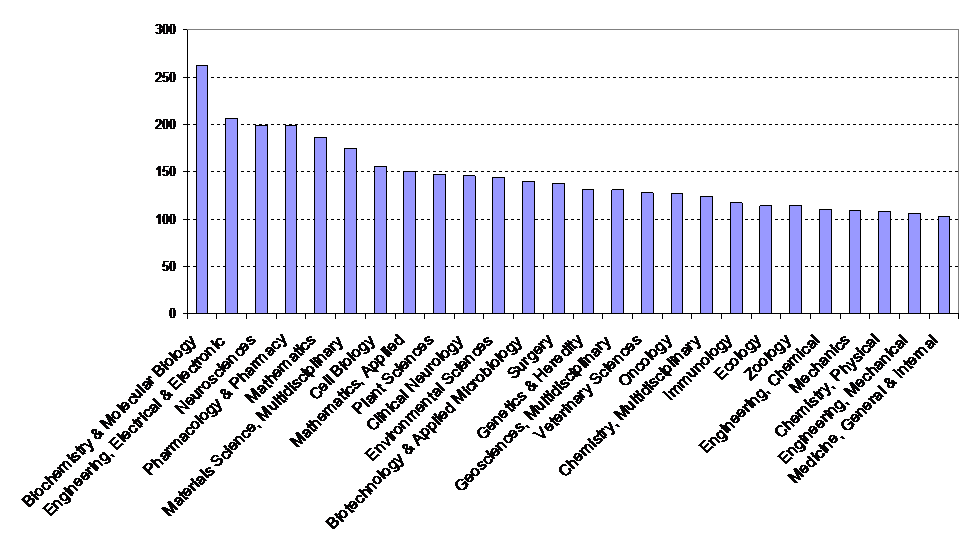
Figure 1: Frequency of 27 ISI Subject
Categories which occur more than hundred times (JCR 2006).
The ISI subject categories match poorly with classifications
derived from the database itself on the basis of an analysis of the principal
components of the networks generated by citations (Leydesdorff, 2006: 611f.).
Using a different methodology, Boyack et al.
(2005) found that in somewhat more than 50% of the cases the ISI
categories corresponded closely with the clusters based on inter-journal
citation relations. These results accord with the expectation: many journals
can be assigned unambiguous affiliations in one core set or another, but the
remainder, which is also a large group, is heterogeneous (Bradford, 1934;
Garfield, 1972).
This multidimensional set offers a wealth of options for
generating representations. One should not expect a unique map of science, but
a number of possible representations. Each map contains a projection from a
specific perspective. However, one can ask whether there is a robust structure
in terms of the latent dimensions of the underlying matrix. Using the ISI subject
categories, we find that the system can be decomposed into fourteen factors or
macro-disciplines. These macro-disciplines display three clusters: a biology-medicine
cluster, a physics-materials-engineering-computing cluster, and a environment-ecology-geosciences
cluster. This structure accords with the standard view of the organization of
the sciences into disciplines.
Methods
The data was harvested from the CD-Rom version of the Journal
Citation Reports of the Science Citation Index 2006. As indicated
above, 175 subject categories are used. Three categories (“Psychology, biological,”
“Psychology, experimental,” and “Transportation”) are no longer used as
classifiers in the citing dimension, but four journals are still indicated with
these three categories in the cited dimension. Thus, we work with 172 citing categories
and 175 cited.
The matrix, accordingly, contains two structures: a cited
and a citing one. Salton’s cosine was used for normalization in both the cited
and the citing directions (Salton & McGill, 1983; Ahlgren et al.,
2003). Pajek is used for the visualizations (Batagelj and Mvar, 2007) and SPSS (v15)
for the factor analysis. The threshold for the visualizations is pragmatically
set at cosine > 0.2. Visualizations are based on the algorithm of Kamada
& Kawai (1989). The size of the nodes is set proportional to the number of
citations in a given category (or in Figure 3, the logarithm of this value). The
thickness and grey-shade of the links is proportional to the cosine values in
five equal steps of 0.2.
Using a factor model, the crucial question is the number of
factors to be extracted. Unless one has a priori reasons for testing an
assumption, this number has to be determined on empirical grounds (Leydesdorff,
2006). SPSS includes by default all factors with an eigenvalue larger than
unity. The screeplot of the eigenvalues can be used for the assessment of the
number of meaningful factors. However, the assumption has to be tested against
the data.
Results
Unlike the aggregated journal-journal citation matrix, the
matrix of 172 (citing) times 175 (cited) categories is not sparse: 11,577 of
the (172 x 175 =) 30,100 cells have a zero value. This corresponds with 38.46%
of the number of cells.
Since the categories are unevenly distributed, one cannot set a threshold value
across the matrix without normalization. The factor analysis, however, begins
with a normalization using the Pearson correlation coefficient. As noted, the
visualizations are based on cosine values. The cosine is equal to the Pearson
correlation, but without normalization to the arithmetic mean (Jones &
Furnas, 1987).
Let us focus on the structure in the citing dimension
because this structure is actively maintained by the indexing service and is therefore
current. The screeplot of the eigenvalues suggests a fourteen-factor solution
(Figure 2).
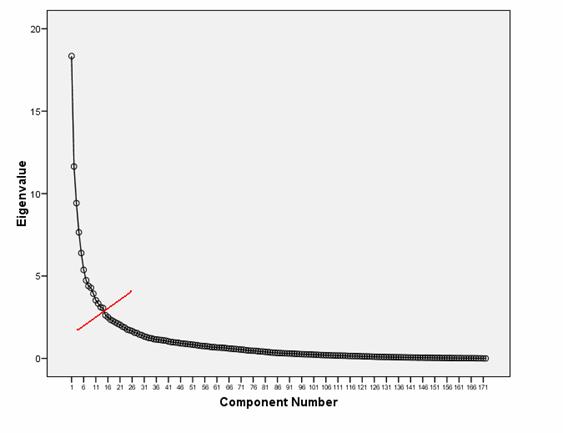
Figure 2. Scree plot of the Factor Analysis (Citing)
Table 1 shows the four highest loadings on the last factor
in the case of extracting 13, 14, or 15 factors, respectively. This confirms
that the quality of the factors declines considerably after extracting 14
factors. The fourteen-factor solution explains 51.8% of the variance of the
matrix in the citing projection, and 47.9% of the variance in the cited
projection.
|
Highest factor loadings
on factor 13 in the case of a 13-factor solution
|
Highest factor loadings
on factor 14 in the case of a 14-factor solution
|
Highest factor loadings
on factor 15 in the case of a 15-factor solution
|
|
0.779
|
0.786
|
0.593
|
|
0.715
|
0.721
|
0.539
|
|
0.672
|
0.698
|
0.484
|
|
0.669
|
0.687
|
0.472
|
Table 1: Highest factor loadings on the last factor
in a 13-, 14-, and 15-factor solution, respectively.
The factor loadings for the 172 categories on the fourteen
factors in the citing dimension are provided in Appendix I. They can be interpreted
in terms of disciplines, such as Physics, Chemistry, Clinical Medicine, Neurosciences,
Engineering, Ecology, etc.
The factors in the cited dimension can be designated using precisely
the same disciplinary classification, but their rank-order (that is, the
percentage of variance explained by each factor) is different (Table 2). 154
out of the 172 categories (that is, 89%) fall in the same factor in both the
citing and cited projections. The eighteen categories that are classified
differently in the citing and cited projections are listed in Table 3.
|
|
Citing factors
|
Cited factors
|
|
Biomedical Sciences
|
1
|
1
|
|
Materials Sciences
|
2
|
2
|
|
Computer Sciences
|
3
|
4
|
|
Clinical medicine
|
4
|
5
|
|
Neuro Sciences
|
5
|
3
|
|
Ecology
|
6
|
7
|
|
Chemistry
|
7
|
9
|
|
Geosciences
|
8
|
6
|
|
Engineering
|
9
|
8
|
|
Infectious diseases
|
10
|
10
|
|
Environmental sciences
|
11
|
12
|
|
Agriculture
|
12
|
11
|
|
Physics
|
13
|
13
|
|
General medicine; health
|
14
|
14
|
Table 2: Fourteen disciplines distinguished on the
basis of ISI Subject Categories in 2006 (ρ > 0.95; p
< 0.01).
|
ISI Subject Category
|
Citing Factor
|
Cited Factor
|
|
Urology
& nephrology
|
Biomedical
Sci.
|
Clinical
Medicine
|
|
Pharmacology
& pharmacy
|
Biomedical
Sci.
|
Neuro-sciences
|
|
Physiology
|
Biomedical
Sci.
|
Neuro-sciences
|
|
Medicine,
legal
|
Biomedical
Sci.
|
Chemistry
|
|
Toxicology
|
Biomedical
Sci.
|
Environmental
Sci
|
|
Biotechnology
& applied microbiology
|
Biomedical
Sci.
|
Agriculture
|
|
Nutrition
& dietetics
|
Biomedical
Sci.
|
Agriculture
|
|
Mathematical
& computational biology
|
Biomedical
Sci.
|
General
Medicine; Health
|
|
Energy
& fuels
|
Materials
Sci.
|
Engineering
|
|
Computer
sci., interdiscipl. Applic.
|
Computer
Sci.
|
Engineering
|
|
Mathematics
|
Computer
Sci.
|
Engineering
|
|
Engineering,
industrial
|
Computer
Sci.
|
Physics
|
|
Chemistry,
physical
|
Chemistry
|
Materials
Sci.
|
|
Materials
science, biomaterials
|
Chemistry
|
Materials
Sci.
|
|
Chemistry,
applied
|
Chemistry
|
Agriculture
|
|
Materials
science, composites
|
Engineering
|
Materials
Sci.
|
|
Mycology
|
Infect.
Diseases
|
Agriculture
|
|
Medicine,
general & internal
|
Medicine
General
|
Clinical
Medicine
|
Table 3: Eighteen ISI Subject Categories that are
classified differently in the citing and cited dimensions.
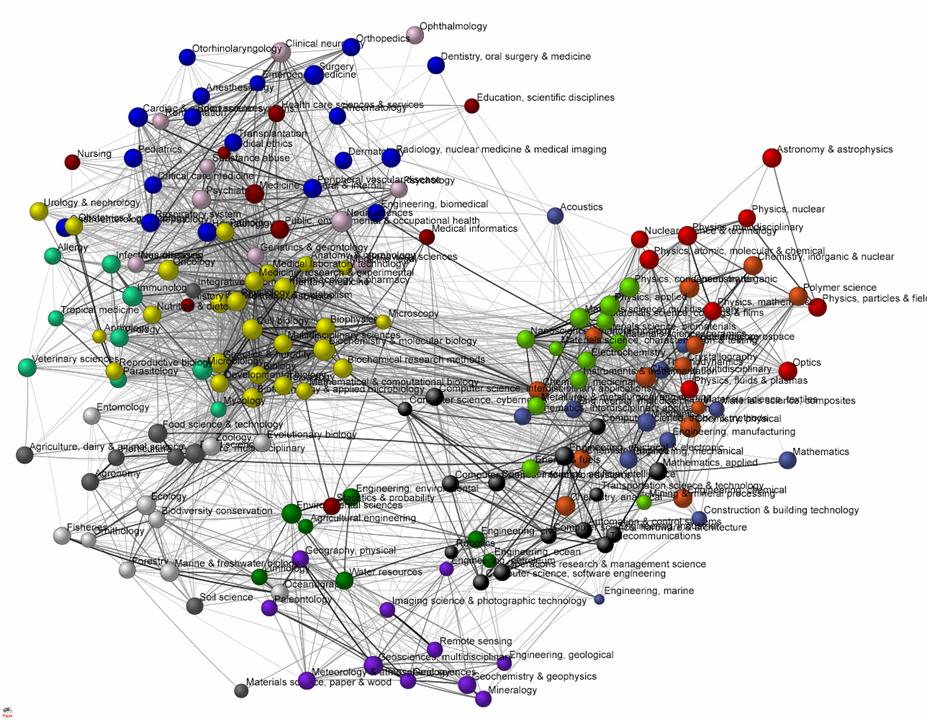
Figure 3 shows the map of 171 ISI subject categories which
relate above the threshold of cosine > 0.2. The category “Agricultural
economics and politics” is not related at this level. The nodes represent the
categories and are colored in terms of the fourteen factors. (The picture in
the cited dimension is very similar.) In this chart, the node sizes were set
proportional to the logarithm of the number of citations (in the
respective subject category) in order to keep the visualization readable.
Figure 3: 171 ISI subject
categories in the citing dimension; cosine > 0.2. Node sizes set
proportional to the logarithm of the number of citations given by each category.
Whereas the traditional disciplines are represented by clear
factors (e.g., Physics or Chemistry), specific fields of application in mathematics
or engineering do not fall in the disciplinary classification, but in the factor
representing their topic. For example, Mathematical Physics is classified as Physics,
while Mathematics is classified as part of Engineering and with a second factor
loading on the Computer Sciences. Chemical Engineering loads on the Chemistry factor
more than on the one representing Engineering.
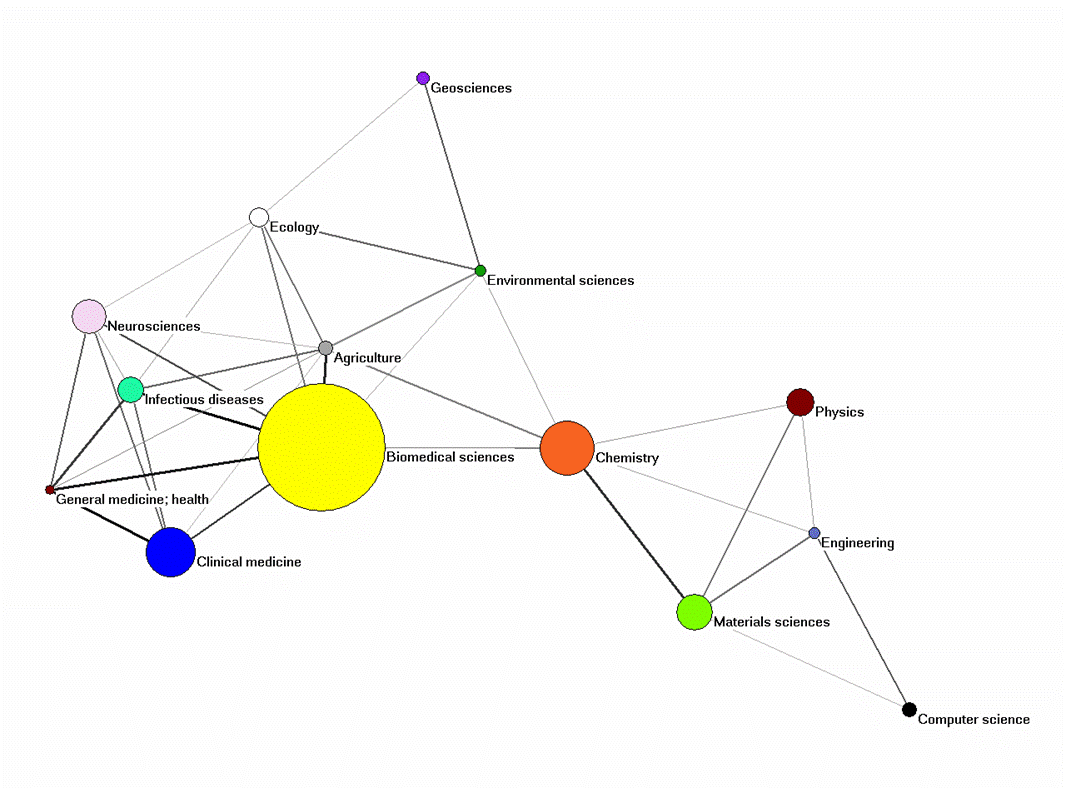
Figure 4: Fourteen disciplines in the citing dimension;
cosine > 0.2. (The colors correspond with those used in Figure 3.)
Figure 4 shows the citation relations among the fourteen
groups. (The depiction in the cited dimension is again virtually similar to
this one in the citing dimension.) While Figure 3 informed us in greater detail
about the relations among subdisciplines and specialties, the factor-analytical
categories allow us to depict these ISI subject categories in Figure 3 with
different colors in terms of the disciplinary affiliations provided in Figure
4. Both levels are interactively related with hyperlinks at http://www.leydesdorff.net/map06/index.htm
.
The largest factor is designated as Biomedical Sciences. It
includes at the disaggregated level:
- The core biological sciences, such as Biochemistry &
Molecular Biology, Developmental Biology, Genetics, and Cell Biology;
- The methodologies crucial for the biological sciences,
such as Microscopy and Biochemical Research Methods;
- Disciplines that fall into medicine but are highly
interrelated with the biological sciences, such as Oncology and Pathology.
Among the latter, eight subject categories (e.g., Physiology,
Toxicology, or Nutrition Sciences) have a citing pattern in the factor of the
Biomedical Sciences (that is, they draw on basic biological knowledge), but they
show a cited pattern in factors more related to specific applications such as
Neurosciences, Environmental Sciences, or Infectious Diseases (see Table 3
above).
Four factors are closely associated with the Biomedical
Sciences: Clinical Medicine, Neurosciences, Infectious Diseases, and General
Medicine & Health. At the opposite pole of the medicine-related factors, we
find factors based on the hard sciences: the factors of Physics, Engineering,
Materials Sciences, and Computer Sciences, are among them. Chemistry plays a
brokerage role between Physics and Material Sciences, on the one side, and core
Biomedical Sciences such as Biophysics and Biochemistry, on the other.
The relative positions of the subject categories within
Figure 3 inform us prima facie about their disciplinary or
interdisciplinary character. However, one should be cautious in drawing
conclusions from a visual inspection of maps. A map remains a two-dimensional
projection of a space (in this case, a fourteen-dimensional one), and one therefore
needs a large number of projections from different angles before one can
formulate hypotheses on this basis. In a next section, we will use betweenness
centrality as a measure of interdisciplinarity for comparing the results at the
level of ISI subject categories with the lower level results of aggregated
journal-journal citations.
On the basis of a number of these projections—that is,
variants of Figure 3—we feel comfortable in suggesting that the connection
between the “medical pole” and the “hard-science pole” is achieved by the way
of three main routes:
- A direct link between the Computer Sciences and some of
the medical specialties such as Psychology, Neuro-imaging, and Medical
Informatics;
- Through Chemistry, which appears to play a brokerage role
between Physics and Material Sciences, on the one side, and the core
Biomedical Sciences such as Biophysics and Biochemistry, on the other;
- Through a path that links Engineering and Material
Sciences with Geosciences and Environmental Sciences, and also connects
these two latter factors with Ecology and Agriculture. The latter are
related to Infectious Diseases and the large set of journals in the
Biomedical Sciences. This path can be considered as a small cluster with a
focus on environmental issues.
Our results are consistent with previously reported maps
(Boyack et al. 2005; Boyack and Klavans, 2007), but we chose to exclude
the social sciences. We would expect differences and similarities when mapping
the social sciences (using the Social Science Citation Index) because of
the different order of magnitude of citations in the journal-journal citation
network, differences in citation behavior, and the different functions of citations
as relations among texts in these sciences.
Interdisciplinarity
Various studies of interdisciplinarity have been based on
the assumption that journals can be grouped using the ISI subject categories
(e.g., Van Leeuwen & Tijssen, 2000; Morillo et al., 2001, 2003). “Interdisciplinarity”
is often a policy objective, while new developments may take place at the
borders of disciplines (Zitt, 2005). One of the potential uses of a map of
science is to help us understand the cognitive base and the relative positions
of emerging fields (Van Raan, 2000; Bordons et al., 2004; Porter et
al., 2006 and 2007).
In another context, one of us argued for using betweenness
centrality in the vector space as a measure of interdisciplinarity in local
citation environments (Leydesdorff, 2007b). The citation matrix among ISI
subject categories provides us with a global map. Could one use this
same measure for interdisciplinarity—that is, betweenness centrality after
transformation of the data into a vector space using the cosine—as a measure of
interdisciplinarity at the level of the ISI subject categories? A case study of
an interdisciplinary development relevant to our data can teach us more about
the relations between the three levels of aggregation: (1) aggregated journal-journal
citation data, (2) citation relations among ISI subject categories, and (3)
citation relations among the fourteen factors.
“Nanoscience & nanotechnology” can be considered as an
interesting case in point: within the policy arena this research domain was constructed
as a critical and highly interdisciplinary field (Kostoff, 2004; 2007), but
this interdisciplinarity has remained controversial in the various
mapping efforts (Schummer, 2004; Leydesdorff & Zhou, 2006; Rafols &
Meyer, 2007). The ISI added the subject category of “Nanoscience &
nanotechnology” (NS) in 2005. Twenty-seven journals were subsumed under this
category in 2005 and 32 in 2006.
Note that the focus in Leydesdorff’s (2007b) proposal to use
betweenness centrality as a measure of interdisciplinarity was formulated in
terms of citation impact and not in terms of citation behavior. Thus, we will use
in this analysis the other side of the citation matrix among subject
categories. Among the 175 subject categories in this (“cited”) direction, the
newly added category NS contributes only 1.16% to the betweenness centrality. (Among
the 172 subject categories in the citing dimension this is 1.5%.),
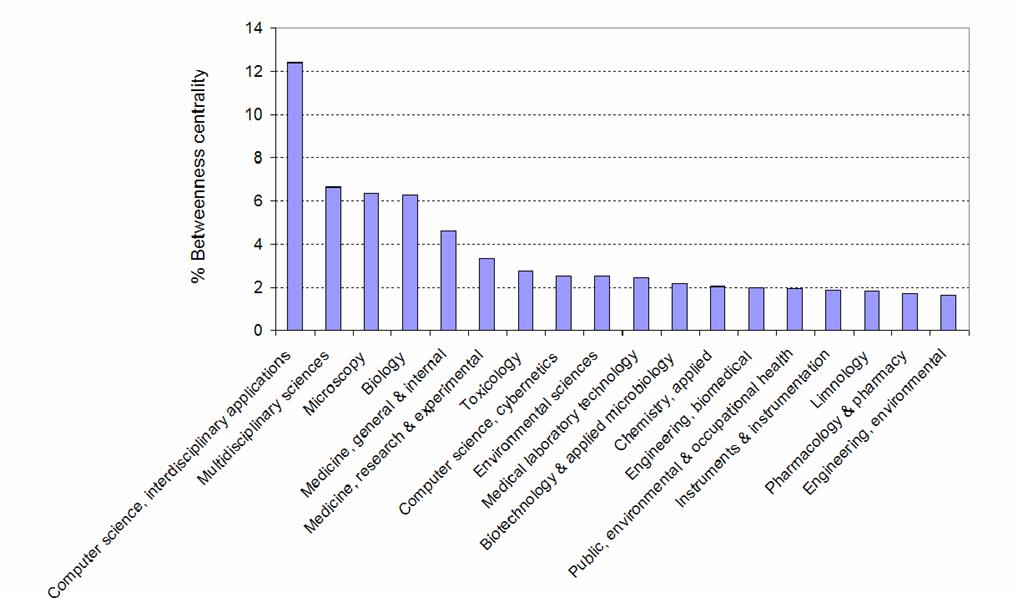
Figure 5: Eighteen ISI Subject Categories with contribute
1.5% or more to the betweenness centrality in the vector space in the cited
dimension.
Figure 5 shows the 18 ISI subject categories that contribute
with 1.5% percent or more to the betweenness centrality in the matrix. Not
surprisingly, the category of “Computer science, interdisciplinary
applications” leads the ranking. This corresponds with visual inspection of
Figure 3. Categories like “Microscopy” (6.34%) and “Instruments &
instrumentation” (1.87%) are also included, but the latter not to the extent one
would expect on the basis of theoretical contributions (Price, 1984; Shinn
& Joerges, 2002). The position of “Biology” in this ranking is surprising.
Can the discipline of biology also be considered as an interdisciplinary field
when analyzed in terms of subject categories?
As against betweenness centrality among journals in local
citation environments, this betweenness centrality among categories informs us
about which categories are holding the science system together more than others
at the level of the database. The computer sciences and general bio-medical
categories seem to play a key role. At the level of subject categories we note
a shift from chemistry, with high betweenness centrality at the level of
disciplines (Figure 4 above), towards biology at the level of subject categories.

Figure 6: 37 ISI Subject Categories in the cited environment
of “Nanoscience & nanotechnology” (cosine > 0.2). Legend of factors: Red
circles = Materials Sciences; Brown triangles = Chemistry; Light squares =
Engineering; Black Squares = Physics; Light circle = Biomedical Sciences.
The disciplinary and interdisciplinary structures are
nested. Within each local area—represented by a subset—one can expect again a
division between journals that form the core of a specific set and are in this
sense more central to the discipline, and journals that reach with citations across
the borders between different sets. Figure 6 provides the k = 1
neighbourhood of the ISI subject category “Nanoscience & nanotechnology” as
a selection of 37 of the 175 subject categories related at the level of cosine
> 0.2. Among them, twelve subject categories have their highest factor
loading on the factor that was designated as “Materials Sciences” in Appendix I.
However, the match is not perfect. “Chemistry, physical” for example, contributes
considerably to the betweenness centrality (3%), but is classified as Chemistry;
“Engineering, multidisciplinary” (3%) similarly contributes to the betweenness
centrality more than “Metallurgy & metallurgic engineering,” which is classified
as “Materials Sciences.”
These results can be appreciated as indicating problems of
classification in a fuzzy set. “Nanoscience and nanotechnology” itself contributes
5.4% to the betweenness centrality in this environment, but “Materials science,
biomaterials” leads the ranking with 5.6% although it is poorly connected to
the core set. Thus, this map is comprehensible but not conclusive. The
categories are on average more closely related to one another in terms of
aggregate citations than the journals. However, the cosine-normalized map does
not exhibit a structure as we know it from the journal mapping, to which we
will now proceed.
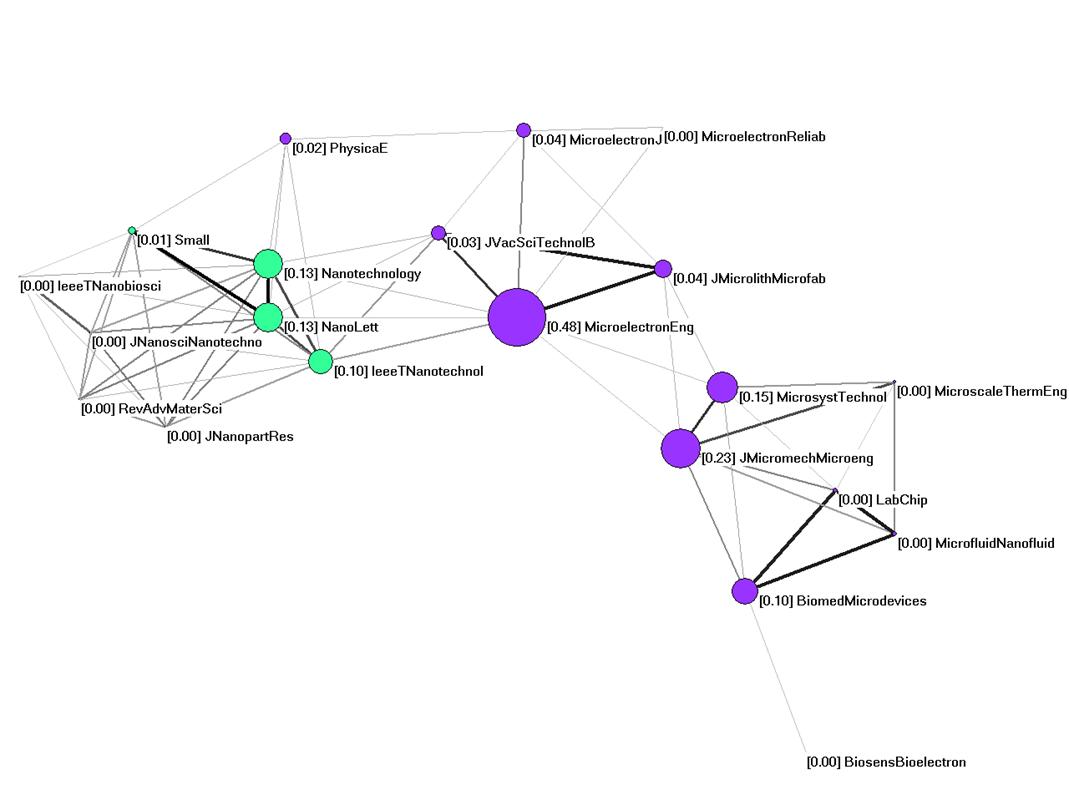
Figure 7: Betweenness centrality in the citation
impact environments of 21 journals classified as “Nanoscience and
nanotechnology” in 2006; cosine > 0.2.
Figure 7 shows the relations among the citation patterns of 21
journals classified as “Nanoscience and nanotechnology.” Of the 32 journals
classified under this category by the ISI, the journal Nanoscale and Microscale
Thermophysical Engineering was cited only one once in 2006 and was therefore
left aside. Ten other journals are not related to the central network at the
threshold level of cosine > 0.2. For example, Fullerenes Nanotubes and
Carbon Nanostructures is not cited in a manner similar to these journals,
but it is related in terms of its citing pattern. However, the density of the
underlying citation matrix among these 32 journals is 34.2%.
The transition to the vector space—that is, the
normalization in terms of cosine values—clarifies the structure in the matrix: Microelectronic
Engineering is the single journal with the highest betweenness centrality
(47.6%). However, it is not part of the cluster of journals with “nano” in
their title. The latter form a separate cluster, but they are not leading in
terms of betweenness centrality.
In Leydesdorff (2007b: 1317), the journal Nano Letters was
selected as the seed journal for drawing a relevant impact environment into the
analysis. This journal was chosen because it had by far the highest impact
factor in this environment in 2004 (8.449), and this analysis was based on
citation impact. By 2006, the impact factor of Nano Letters had further increased
to 9.960, but other journals like Small and Lab on a Chip now
also have impact factors around 6.0. If we repeat the analysis of 2004 for
2006, 18 instead of 17 journals are relevant in the citation environment of Nano
Letters to the extent that they contribute more than 1% to its total
citations. Figure 8 provides the visualization in terms of betweenness
centrality in the vector space.
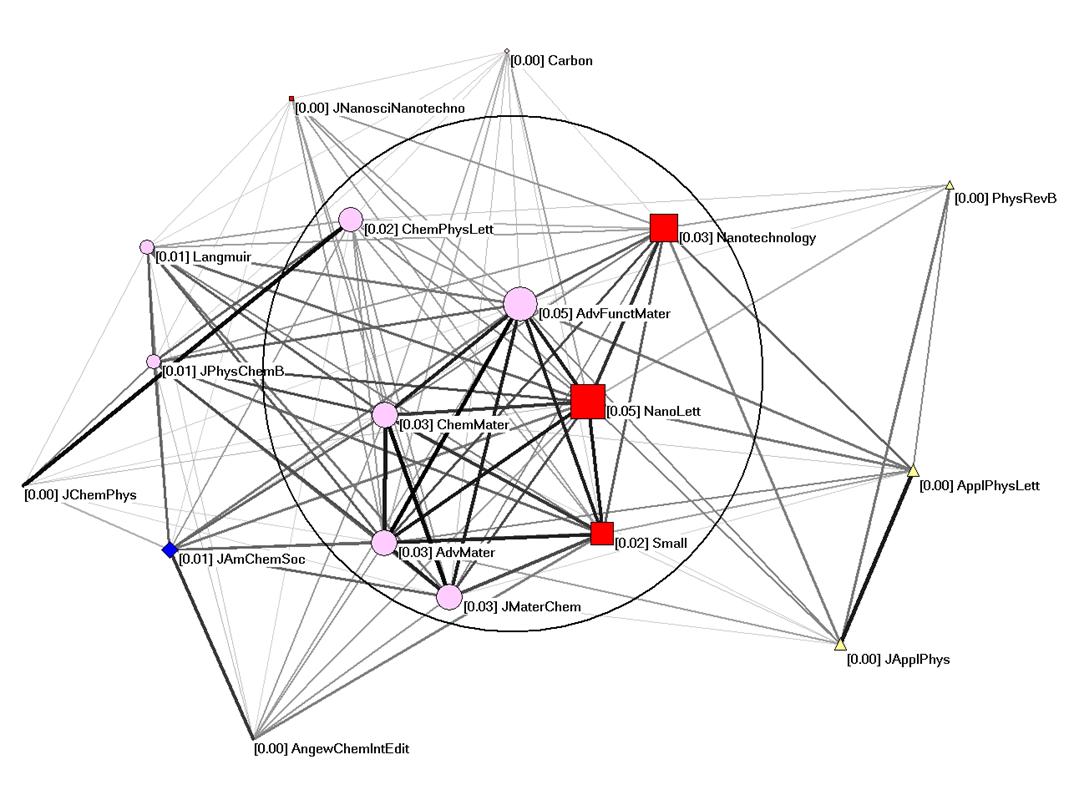
Figure 8: Betweenness centrality of 18 journals in
the citation impact environment of Nano Letters 2006 (cosine > 0.2).
Colors and shapes of nodes correspond to the ISI Subject Categories: squares
for “Nanoscience & nanotechnology,” circles for “Chemistry, physical”;
triangles for “Physics, applied,” and diamonds for “Chemistry,
multidisciplinary.”
Figure 8 shows an interdisciplinary set, but the set is composed
of journals assigned to the new subject category for “nano,” on the one hand,
and “physical chemistry,” on the other. The orientation of Nano Letters to
the emerging set of nano-journals in 2004 is now overshadowed by its
intermediating function between chemistry journals and nano-journals. (Nano
Letters is published by the American Chemical Society!) In other words, the
structure of the field has changed in the local citation impact environment of Nano
Letters. This can be signaled by using the betweenness centrality indicator
at the level of journals, but not by using the ISI subject categories.
Conclusions and discussion
The analysis of “Nanoscience
& nanotechnology” at various levels of aggregation (journals, ISI subject
categories, and factors representing disciplines) suggests that the ISI subject
categories function moderately well for the classification. They do not match
with the fine-grained picture that can be constructed when using aggregated
journal-journal citations, but the latter have the disadvantage that they are
difficult to map at higher levels of aggregation (like specialties and
disciplines in a bottom-up mode) without making assumptions.
One may wonder why the ISI
subject categories that were found to be a poor match for journal citation
patterns in other research (Boyack et al., 2005; Leydesdorff, 2006)
perform relatively well when used as aggregates, and can then further be
aggregated in order to provide comprehensive maps of science in both the cited
and citing dimensions. The explanation is statistical: Boyack et al.
(2005) noted that the ISI subject categories match in approximately 50% of the cases
and mismatch consequently in the remaining 50%. The error, however, is not
systematic so that the 50% matching cases prevail in the aggregate. Factor analysis
enables us to distinguish the pattern as a signal from the noise. Thus, a clear
factor structure can be discerned at this intermediate level.
From the top-down perspective
of the factor structure, the noise at the bottom level can be considered as mere
variation which is distributed stochastically. Factor analysis enables us to reduce
the complexity in the data. As we noted above, the resulting maps match well
with the previously published mappings of the team of Boyack, Börner, and
Klavans. The maps of the latter can be found at http://mapofscience.com. The matrix of
aggregated inter-category citations is available at http://www.leydesdorff.net/map06/data.xls.
This file enables users to draw one’s own maps or make one’s own extractions
and inferences. The maps are available as a nested structure at http://www.leydesdorff.net/map06/index.htm.
return
References:
Ahlgren, P., Jarneving, B., & Rousseau,
R. (2003). Requirement for a Cocitation Similarity Measure, with Special
Reference to Pearson's Correlation Coefficient. Journal of the American
Society for Information Science and Technology, 54(6), 550-560.
Batagelj, V., &
Mrvar, A. (2007) Pajek. Program for Large Network Analysis. Retrieved on
October 4, 2007 from, http://vlado.fmf.uni-lj.si/pub/networks/pajek/.
Bensman, S. J.
(2001). Bradford’s law and fuzzy sets: Statistical implications for library
analyses. IFLA Journal, 27, 238-246.
Bordons, M.,
Morillo, F., & Gómez, I. (2004). Analysis of cross-disciplinary research
through bibliometric tools. In H. F. Moed, W. Glänzel & U. Schmoch (Eds.), Handbook
of quantitative science and technology research (pp. 437-456). Dordrecht: Kluwer.
Boyack, K. W.,
Klavans, R., & Börner, K. (2005). Mapping the Backbone of Science. Scientometrics,
64(3), 351-374.
Boyack, K.,
Börner, K., & Klavans, R. (2007). Mapping the Structure and Evolution of
Chemistry Research. In D. Torres-Salinas & H. Moed (Eds.), Proceedings
of the 11th International Conference of Scientometrics and
Informetrics, Vol. 1, pp. 112-123, CSIC, Madrid, 21-25 June 2007.
Boyack, K., &
Klavans, R. (2007) A map of science. Retrieved on October 4, 2007, from http://mapofscience.com/.
Bradford, S. C.
(1934). Sources of information on specific subjects. Engineering, 137,
85-86.
Burt, R. S.
(1982). Toward a Structural Theory of Action. New York, etc.: Academic
Press.
Callon, M.,
Courtial, J.-P., Turner, W. A., & Bauin, S. (1983). From Translations to
Problematic Networks: An Introduction to Co-word Analysis, Social Science
Information 22, 191-235.
Callon, M., Law,
J., & Rip, A. (Eds.). (1986). Mapping the Dynamics of Science and
Technology. London: Macmillan.
Carpenter, M. P.,
& Narin, F. (1973). Clustering of Scientific Journals. Journal of the
American Society for Information Science, 24, 425-436.
Chan, L. M.
(1999). A Guide to the Library of Congress Classification. 5th ed. .
Englewood, CO: Libraries Unlimited.
Davidson, G. S.,
Hendrickson, B., Johnson, D. K., Meyers, C. E., & Wylie, B. N. (1998).
Knowledge Mining With VxInsight: Discovery Through Interaction. Journal of
Intelligent Information Systems, 11(3), 259-285.
Doreian, P.,
& Fararo, T. J. (1985). Structural Equivalence in a Journal Network. Journal
of the American Society for Information Science, 36, 28-37.
Garfield, E.
(1972). Citation Analysis as a Tool in Journal Evaluation. Science 178(Number
4060), 471-479.
Jones, W. P.,
& Furnas, G. W. (1987). Pictures of Relevance: A Geometric Analysis of
Similarity Measures. Journal of the American Society for Information
Science, 36(6), 420-442.
Kamada, T., &
Kawai, S. (1989). An algorithm for drawing general undirected graphs. Information
Processing Letters, 31(1), 7-15.
Klavans, R.,
& Boyack, K. (2007). Is there a Convergent Structure of Science? A
Comparison of Maps using the ISI and Scopus Databases. In D. Torres-Salinas
& H. Moed (Eds.), Proceedings of the 11th International
Conference of Scientometrics and Informetrics, Vol. 1, pp 437-448, CSIC,
Madrid, 21-25 June 2007.
Kostoff, R.
(2004). The (Scientific) Wealth of Nations. The Scientist, 18(18), 10.
Kostoff, R. N.,
Koytcheff, R. G., & Lau, C. G. Y. (2007). Global nanotechnology research
metrics. Scientometrics, 70(3), 565-601.
Leydesdorff, L.
(1986). The Development of Frames of References. Scientometrics 9,
103-125.
Leydesdorff, L. (1987).
Various methods for the Mapping of Science. Scientometrics 11, 291-320.
Leydesdorff, L.
(1989). Words and Co-Words as Indicators of Intellectual Organization. Research
Policy, 18, 209-223.
Leydesdorff, L.
(2004). Clusters and Maps of Science Journals Based on Bi-connected Graphs in
the Journal Citation Reports. Journal of Documentation, 60(4), 371-427.
Leydesdorff, L.
(2006). Can Scientific Journals be Classified in Terms of Aggregated
Journal-Journal Citation Relations using the Journal Citation Reports? Journal
of the American Society for Information Science & Technology, 57(5),
601-613.
Leydesdorff, L. (2007a). Visualization of the Citation Impact
Environments of Scientific Journals: An online mapping exercise. Journal of
the American Society of Information Science and Technology, 58(1), 207-222.
Leydesdorff, L. (2007b). “Betweenness Centrality” as an Indicator of the “Interdisciplinarity”
of Scientific Journals, Journal of the American Society for Information
Science and Technology 58(9), 1303-1309.
Leydesdorff, L. and Zhou, P. (2007). Nanotechnology as a Field of Science: Its Delineation in
Terms of Journals and Patents. Scientometrics, 70(3),
693-713.
Morillo, F.,
Bordons, M., & Gómez, I. (2001). An approach to interdisciplinarity through
bibliometric indicators. Scientometrics, 51(1), 203-222.
Morillo, F.,
Bordons, M., & Gómez, I. (2003). Interdisciplinarity in Science: A
Tentative Typology of Disciplines and Research Areas. Journal of the
American Society for Information Science and Technology, 54(13), 1237-1249.
Newman, M. E. J.
(2006a). Finding community structure in networks using the eigenvectors of
matrices. Physical Review E, 74(3), 36104.
Newman, M. E. J.
(2006b). Modularity and community structure in networks. Proceedings of the National Academy of Sciences, 103(23), 8577-8582.
Porter, A. L.,
Roessner, J. D., Cohen, A. S., & Perreault, M. (2006). Interdisciplinary
research: meaning, metrics and nurture. Research Evaluation, 15(3),
187-195.
Porter, A. L.,
Cohen, A. S., David Roessner, J., & Perreault, M. (2007). Measuring
researcher interdisciplinarity. Scientometrics, 72(1), 117-147.
Price, D. J. de
Solla (1965). Networks of scientific papers. Science, 149, 510- 515.
Price, D.J. de
Solla (1984). The science/technology relationship, the craft of experimental
science, and policy for the improvement of high technology innovation. Research
Policy 13(1), 3-20.
Rafols, I. and Meyer, M. (2007) How cross-disciplinary is bionanotechnology? Explorations in the
specialty of molecular motors. Scientometrics 70(3), 633-650.
Salton, G., &
McGill, M. J. (1983). Introduction to Modern Information Retrieval. Auckland, etc.: McGraw-Hill.
Schummer, J.
(2004) Multidisciplinarity, Interdisciplinarity, and patterns of research
collaboration in nanoscience and nanotechnology. Scientometrics 59,
425-465.
Shinn, T., & Joerges,
B. (2002) The transverse science and technology culture: dynamics and roles of
research-technologies. Social Science Information 41(2), 207-251.
Simon, H. A.
(1973). The Organization of Complex Systems. In H. H. Pattee (Ed.), Hierarchy
Theory: The Challenge of Complex Systems (pp. 1-27). New York: George
Braziller Inc.
Small, H. (1973).
Co-citation in the Scientific Literature: A New measure of the Relationship
between Two Documents. Journal of the American Society for Information
Science, 24(4), 265-269.
Small, H., &
Griffith, B. (1974). The Structure of Scientific Literature I. Science
Studies 4, 17-40.
Small, H., &
Sweeney, E. (1985). Clustering the Science Citation Index Using Co-Citations I.
A Comparison of Methods,. Scientometrics 7, 391-409.
Tijssen, R., de
Leeuw, J., & van Raan, A. F. J. (1987). Quasi-Correspondence Analysis on
Square Scientometric Transaction Matrices. Scientometrics 11, 347-361.
Van Leeuwen, T.,
& Tijssen, R. (2000). Interdisciplinary dynamics of modern science:
analysis of cross-disciplinary citation flows. Research Evaluation, 9(3),
183-187.
Van Raan, A. F.
J. (2000). The Interdisciplinary Nature of Science. Theoretical Framework and
Bibliometric-Empirical Approach. In P. Weingart & N. Stehr (Eds.), Practicing
Interdisciplinarity (pp. 66-78). Toronto: University of Toronto Press.
Zitt, M. (2005).
Facing Diversity of Science: A Challenge for Bibliometric Indicators. Measurement:
Interdisciplinary Research and Perspectives, 3(1), 38-49.
return