The new Excellence Indicator in the World Report of
the SCImago Institutions Rankings 2011
Lutz Bornmann,[1] Felix de Moya-Anegón,[2] and Loet Leydesdorff [3]
z-test for
significance testing of ranks and differences among ranks![]()
The SCImago Institutions Rankings (SIR) World Reports publish annually an international ranking of more than 2000 research institutions and organizations. The reports list indicator values based on publication and citation data from Scopus (Elsevier) for research-devoted institutions with at least 100 papers published within one year. The second edition published in 2010 included for each institution the following four indicators: (1) publication output, (2) output ratio which has been produced in collaboration with foreign institutions (international collaboration), (3) ratio between the average scientific impact of an institution and the world average impact of papers published in the same time period and subject area (normalized impact), and (4) ratio of papers which an institution publishes in the most influential scholarly journals of the world (high quality publications).
In the third edition of the World Report published recently (available at http://www.scimagoir.com/pdf/sir_2011_world_report.pdf) a new excellence indicator is included which can be traced back to the methodological developments of Bornmann and Leydesdorff (2011) and Leydesdorff, Bornmann, Mutz, and Opthof (2011). The excellence indicator shows the percentage of papers published by an institution belonging to the top-10% papers within its field of publication. Tijssen, Visser, and van Leeuwen (2002) and Tijssen and van Leeuwen (2006) argued that the top-10% of papers with the highest citation counts in a publication set can be considered as highly cited (see also Lewison, Thornicroft, Szmukler, & Tansella, 2007).
For example, an excellence indicator of 22% for an institution means that 22% of its papers belong to the top-10% of papers among those published in the same year and subject area (e.g., Biochemistry, Genetics & Molecular Biology; Immunology & Microbiology). The indicator is an item-oriented field-normalized citation score because each paper in an institutional publication set is analyzed whether it belongs to the top-10% of papers in the set of papers (covered by Scopus) with the same publication year and subject area.
The excellence indicator has two advantages: First, the percentage for an institution (the observed number) can be compared with the reference value (expected value) of 10%. The expected number for a set of papers selected at random would be 10% (Agarwal & Searls, 2009; Bornmann & Mutz, 2011). Institutions in the World Report with percentages above 10% perform above the expectation (or above the reference standard) and institutions with percentages below 10% perform below the expectations. The percentages of different institutions (and their deviations from 10%) can be compared directly with each other since they are normalized for respective publication years and subject areas.
Secondly, based on the data in the World Report statistical tests can be calculated to check whether (1) the difference between the institution’s percentage and the expected value of 10% or (2) the percentage difference between two institutions is statistically significant. The statistical significance test analyzes whether the difference (e.g., between the observed and expected institution’s number of top-10% papers) which is reached on the base of a sample (e.g., papers published between 2003 und 2007) is valid (in all likelihood) for all (ever published) papers of the institute in question (covered by Scopus) (Bornmann, Mutz, Neuhaus, & Daniel, 2008). If the test is statistically significant the difference does not seem to be a random event but can be interpreted beyond the analyzed sample data.
The z test for two independent proportions (Sheskin, 2007, pp. 637-643) can be used for evaluating the degree to which an observed number differs from the expected number or whether the observed numbers for two institutions differ, respectively (Bornmann & Leydesdorff, 2011). The following equation is employed to compute the test statistic for the comparison of observed and expected numbers:
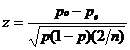
where: n represents the number of all papers published by the institution (column “Output” in the World Report);
po = excellence indicator;
pe = 0.10 = the expected proportion of top-10% papers;
![]()
where: to = the number of top-10% papers calculated on the base of “Output” and “Excellence Indicator” (if the institution’s output is 200 papers and the excellence indicator is 25%, the number of top-10% papers is 50);
te = n/10 = the expected number of the top-10% papers.
z is positively signed if the observed number of top-10% papers is larger than the expected number and negatively signed in the reverse case.
If the comparison of two institutions’ excellence indicators is intended, the following similar equation should be used:

where: n1 and n2 = the numbers of all papers published by institutions 1 and 2 (column “Output” in the World Report);
p1 and p2 = excellence indicators of institutions 1 and 2;
![]()
where: t1 and t2 = the numbers of top-10% papers of institutions 1 and 2 calculated on the base of “Output” and “Excellence Indicator”.
An absolute value of z larger than 1.96 indicates statistical significance at the five percent level (p<.05) for the difference between either observed and expected top-10% paper numbers for one institution or excellence indicator values for two institutions. If a reader of the World Report conducts a series of tests for many institutions, a higher significance level than five percent should be chosen. The critical value for a test based on the one percent level is 2.576.
For example, at the 17th position in the Scimage Institute Ranking, UCLA has an output of 37,994 papers with an excellence indicator of 28.9. Stanford University follows at the 19th position with 37,885 papers and 29.1 excellence. Using the above formulas, p = (10,980.27 + 11,024.54) / (37,994 + 37,885) = 0.290, and z = - 0.607. The difference between these two institution thus is not statistically significant. We provide a calculator at http://www.leydesdorff.net/scimago11/scimago11.xls in which one can fill out this test for any two institutions and also for each institutions on whether it scores significantly above or below expectation (assuming that 10% of the papers are for stochastic reasons in the top-10% set).
As the interpretations and calculations described in this Letter to the Editor show, the simple percentage of top-10% papers for an institution – the new excellence indicator – offers a lot of possibilities for the comparison of an institution with a reference standard and with other institutions by using statistical significance tests.
References
Tijssen, R., & van Leeuwen, T. (2006). Centres of research excellence and science indicators. Can 'excellence' be captured in numbers? In W. Glänzel (Ed.), Ninth International Conference on Science and Technology Indicators (pp. 146-147). Leuven, Belgium: Katholieke Universiteit Leuven.
Tijssen, R., Visser, M., & van Leeuwen, T. (2002). Benchmarking international scientific excellence: are highly cited research papers an appropriate frame of reference? Scientometrics, 54(3), 381-397.