Introduction
Derek de Solla Price’s (1961) fascination with the growth of
journal literature during more than three centuries was followed by both
Garfield and Narin as early pioneers of the bibliometric enterprise. Narin et
al. (1972) elaborated on Price’s (1965) suggestion to use aggregated
journal-journal citations for multivariate analysis in order to distinguish
groups of journals representing specialties, and Garfield (1972) developed
citation analysis as a tool for journal evaluation. Ever since, a large number
of indicators for journals have been developed, and science mapping on the
basis of aggregated journal-journal citations has become an industry (e.g.,
Rosvall & Bergstrom, 2008; Klavans & Boyack, 2009; Leydesdorff &
Rafols, 2009; De Moya-Anegón et al., 2008).
Hitherto, maps and indicators have been largely confined to
the domain of the journals included in the Science Citation Index (SCI)
and the Social Science Citation Index (SSCI) of the Institute of Scientific Information (ISI of Thomson-Reuters). In 2004, both Scopus
and Google Scholar were launched, providing alternatives to the ISI
databases for citation analysis. Although one could in principle construct an
aggregated journal-journal citation matrix from the Google database,
this may not be an easy task (Leydesdorff, 1994). Unlike the SCI and Scopus,
Google Scholar is not delimited in terms of journals processed at the
backend, but on searching the web for scholarly contributions. Journal names in
this case are only attributes to documents and are not controlled for variants
and misspellings.
Both the Science Citation Index and Scopus are
based on a delineation in terms of scholarly journals. The contents of these so-called
“source journals” are processed bibliographically in terms of publications and the
references provided by the authors of these publications. These references
include citations to “non-source” journals, books, reports, patents, etc. Both
Elsevier and the ISI identify a number of journals as additional source
journals when they are cited without including them in terms of the citing
journals. In the Scopus database journals are identified with a unique
item identifier which is kept constant over the years, whereas in the (Social)
SCI the titles of the journals (and their corresponding abbreviations)
function as identifiers.
The ISI aggregates the aggregated citation data among
journals in the yearly Journal Citation Reports (JCR). JCRs
are available since 1974 and 1977 for the Science Citation Index and the
Social Science Citation Index, respectively. Electronic versions on
CD-Rom have been available for these two databases since 1994; since 1997 the
data is also available online. At the time of this project, the latest (2007)
version of the two ISI databases contained 7,940 journals. Note that there is
no JCR available for the Arts & Humanities Citation Index (A&HCI).
Hitherto, Elsevier has not published the aggregated
journal-journal citations among journals contained in the Scopus database.
In 2007, this database contained 23,503 journals with an item identifier; that
is, approximately three times as many as the source journals in the two JCRs
combined (7,940 in 2007). However, only
14,964 (63.7%) of these journals were processed by Scopus in 2007. The
ISI processed 7,925 (99.8%) of the source journals. In other words, the Scopus
references draw upon a much larger pool than the ones included in the JCRs.
The Scopus (1996-2007) data is made available for
scientometric analysis by the Scimago group in Spain (at http://www.scimago.es). This data contains
the full set provided with an item identifier since 1996 (that is, 23,503
journals). In principle, a set of the cited or citing journals for each year
can be derived from this database by using a dedicated routine. We used this
set containing aggregated citations among all journals with item identifiers during
the period 1996-2007.
The unique identification in the Scopus database is
limited backwards to 1996, while the ISI database includes all references
provided in a certain year. This includes both references to non-source
journals and to sources of older dates in the case of the ISI set, while the Scopus
dataset used in this study contains only references to the source journals identified
as items during the period 1996-2007. However, the ISI
database allows us additionally to distinguish between the citations to sources
in the last ten years (1998-2007) and the rest. We shall test below for the
effects of this disaggregation of the ISI database and compare the results with
those obtained using Scopus data covering the period 1996-2007.
The Scopus data allows us to ask questions different
from those addressed to the ISI data. For example, the arts and humanities are
included, and the extension may include many more journals in languages other
than English. The two databases can also be compared on other bibliometric
characteristics such as citation patterns or the h-indices of authors
(Bar-Ilan, 2008; Jacso, 2005 and 2008; Meho & Rogers, 2008; Meho &
Yang, 2007). Focusing on a subset of oncology journals, López-Illescas et
al. (2008) found that with reference to this set, the ISI database could be
considered as a subset of the Scopus database. Although the coverage of
the latter database was 90% larger, the average impact factor in the latter set
was only 2.6% higher than in the ISI set.
Klavans & Boyack (2007) compared maps based on
co-citation analysis at the document level in both databases. Klavans &
Boyack (2009a) argue that a consensus map of science seems possible based on
communalities between the two databases (cf. Rafols & Leydesdorff, 2009).
Recently (July 2009), Elsevier launched a facility SciVal (at http://info.funding.scival.com/ )
based on a further extension of Klavans & Boyack’s (2009b) co-citation maps
of the Scopus data.
We pursue the analysis at the level of journals. Our
original research question was to investigate comparatively the informative
quality of journal maps on the basis of data in the two databases from a user
perspective. Raising questions about the differences, however, brought us to a (second)
analytical question about the different qualities of the data for this purpose.
Can the differences also be explained? As noted, a major difference is the
cutoff in the Scopus data in 1996: data older than 1996 are included,
but not systematically marked with item identifiers, and therefore not usable
for our purpose without considerable data cleaning. The expectation is that the
data of Scopus (1996-2007) are richer than the SCI (1998-2007)
because of the larger coverage, but potentially less informative than the full
set of the SCI because of the cut-off of the historical tails of the
distributions.
The two databases are also different in size. There has been
continuous debate about how the ISI selects journals for inclusion as source
journals in the database (Garfield, 1979, 1990; Testa, 1997). Sivertsen (2003)
found no bias in the coverage of Scandinavian publications by the Science
Citation Index. However, the ISI concedes that the selection system for
inclusion in the Science Citation Index may be biased against journals
written in non-latin alphabets. Special care has been taken in the past to
include Russian and Japanese journals into the database (Garfield, 1979, 1998).
Scopus brings a document online specifying its criteria for inclusion of
journals and other content into the database at http://info.scopus.com/docs/content_coverage.pdf
(retrieved on August 7, 2009).
As reported by Thomson-Reuters Scientific in May 2008,
the SCI was recently extended with another 700 journals in order to
improve its “regional” coverage. Leydesdorff & Wagner (2009) found a
notable effect of this extension on the coverage of Eastern European
contributions, but less so for other world regions. This recent expansion seems
to correspond to the larger coverage by the Scopus database in these
linguistic domains. In other words, the two databases are competing with each other
on the market of academic libraries. In June 2009, the Scopus team
announced to increase the coverage of journals in the arts and humanities to
3,500 by adding all (approximately 1,450) top global journals using the
European Reference Index for the Humanities (ERIH) of the European Science
Foundation. These recent
extensions are not included in our data; the analyses are based on the tape
years 2007 for both datasets.
Language coverage of the journals in the two databases
A major advantage of the larger coverage of the Scopus
data in terms of journals included could be the coverage of journals in
languages other than English. Scopus advertizes at its website to “cover
titles from all geographical regions including non-English titles as long as
English abstracts can be provided.” As noted, the lack
of coverage in the non-English domain has been a major complaint about the ISI
databases (Maricic, 1997; Van Leeuwen et al., 2001). This can
particularly be considered as a problem for the evaluation of research
performance in the social sciences and the humanities (Glänzel & Schöpflin,
1999; Nederhof et al., 2001; Nederhof, 2006).
For example, the French CNRS subsidizes approximately 225
journals which are only partially covered by the U.S.-based Science Citation
Indices (De Looze et al., 1996; Legentil, personal communication). Among
the 4000+ journals published in Chinese only 17 were included in the ISI
database in 2007 (Ren & Rousseau, 2002; Jin et al., 2002;
Leydesdorff & Jin, 2005; Moed, 2002). Eighty journals in the JCRs 2007 were
published in China (but not necessarily in Chinese). Of the 7,940 journals
included in the ISI database, 6,912 (87.1%) are published in English. Another
10.1% of the journals are multilingual, but mostly include English as a main
language. Journals in other languages are marginal to the database ( Table
1).
|
|
ISI
|
%
|
Scopus
1996-2007
|
%
|
Scopus
Aug. 2009
|
%
|
|
English
|
6,912
|
87.1
|
14,109
|
81.1
|
14,193
|
80.7
|
|
Multi-Language
|
802
|
10.1
|
2,993
|
17.2
|
1,227
|
7.6
|
|
German
|
88
|
1.1
|
44
|
0.3
|
363
|
2.1
|
|
French
|
45
|
0.6
|
67
|
0.4
|
292
|
1.7
|
|
Spanish
|
33
|
0.4
|
70
|
0.4
|
360
|
2.1
|
|
Chinese
|
17
|
0.2
|
0
|
0,0
|
323
|
1.8
|
|
Japanese
|
13
|
0.2
|
0
|
0.0
|
126
|
0.7
|
|
Russian
|
13
|
0.2
|
1
|
0.0
|
36
|
0.2
|
|
Portuguese
|
5
|
0.1
|
19
|
0.1
|
110
|
0.6
|
|
Italian
|
2
|
0.0
|
23
|
0.1
|
134
|
0.8
|
|
Rumanian
|
2
|
0.0
|
1
|
0.0
|
7
|
0.0
|
|
Croatian
|
1
|
0.0
|
4
|
0.0
|
33
|
0.2
|
|
Dutch
|
1
|
0.0
|
1
|
0.0
|
30
|
0.2
|
|
Eskimo
|
1
|
0.0
|
0
|
0.0
|
0
|
0.0
|
|
Korean
|
1
|
0.0
|
0
|
0.0
|
15
|
0.1
|
|
Polish
|
1
|
0.0
|
21
|
0.1
|
69
|
0.4
|
|
Slovene
|
1
|
0.0
|
0
|
0.0
|
6
|
0.0
|
|
Swedish
|
1
|
0.0
|
0
|
0.0
|
6
|
0.0
|
|
Turkish
|
1
|
0.0
|
13
|
0.1
|
44
|
0.3
|
|
Hungarian
|
0
|
0
|
10
|
0.1
|
24
|
0.1
|
|
Czech
|
0
|
0
|
2
|
0.0
|
30
|
0.2
|
|
Slovakian
|
0
|
0
|
2
|
0.0
|
6
|
0.0
|
|
Lituanian
|
0
|
0
|
1
|
0.0
|
1
|
0.0
|
|
Danish
|
0
|
0
|
1
|
0.01
|
1
|
0.0
|
|
Iceland
|
0
|
0
|
1
|
0.01
|
0
|
0.0
|
|
other
|
0
|
0
|
0
|
0
|
158
|
1.0
|
|
Total
|
7,940
|
|
17,383
|
|
17,594
|
|
Table 1: Distribution of journals in the ISI and Scopus
databases in terms of languages. The ISI distribution is based on the set in
2007; the Scopus database on the journals included from 1996 to 2007.
Table 1 informs us that this promise of a wider coverage of
languages by the Scopus database can be nuanced. According to Table 1, the
Scopus 1996-2007 database would not contain Chinese, Japanese, or Korean
journals in 2007. Because we aggregated the journal data from the documents, some
journals in these Asian languages are included in the multi-language category. The
extension in the French and German domain seems less substantial than in some
of the other (mainly European) languages. For this reason we checked with
Elsevier (Ove Kahler at Scopus, personal communication, 28 August
2009) who was so kind to provide us with data for the fifth and sixth column,
including the breakdown of the multi-language category as registered by Scopus
at the journal level. Since the totals are approximately the same, one may also
assume that the language distribution in terms of percentages is approximately
the same in our data.
Methods and materials
The aggregated journal-journal citation data of the ISI was harvested
from the CD-Rom version of the Journal Citation Reports 2007. This data
is identical to the online version of the JCR. However, we combined the
two databases for the Science Citation Index and the Social Science
Citation Index into a single JCR. A similar matrix was constructed using
the Scopus database on the basis of the so-called item identities in
both the cited and citing items. Because these item identities are unique, the Scopus
database does not contain errors. Misspellings of journal names, however, are
included in the SCI as references to non-source journals. For example, Leydesdorff
(2008, Table 4, at p. 285) found 14 so-called “non-source journals” in the SCI
based on common misspellings of journal names with values above 10,000 in
2005.
Both datasets were brought under the control of a relational
database management system and exported to Pajek, a freeware program for
the visualization and analysis of networks. The resulting files
are asymmetrical matrices which can be analyzed in both the cited and the
citing dimensions in terms of journal citation patterns. We use SPSS v.15 for
the factor analysis and focus on the cited dimension unless stated otherwise. For
the comparisons between the three sets (Scopus 1996-2007, SCI
1998-2007, and the complete SCI), we extract ego-networks of seed
journals using dedicated software. All journals contributing one percent or
more to the being-cited totals of citations of the seed journal in 2007 are
included in these ego-networks. We use the same sets of journals when comparing
the original ISI data with the truncated set SCI (1998-2007) in order to
facilitate the comparison and for the technical reason that we have no easy
hold in the data for adjusting the chosen thresholds of one percent in the
reduced sets. In all cases, the cosine among the citation patterns is used for
normalization (Ahlgren et al., 2003) with a threshold of cosine >
0.2. We keep the procedures as constant as possible across the different
journal comparisons between the databases.
In the visualizations of the cosine matrices (using Pajek)
the sizes of the nodes are vertically proportionate to the logarithm of the
number of citations, and horizontally to the logarithm of this number after
correction for “within journal self-citations.” The width of the links is
proportionate to the cosine value (above the threshold of cosine > 0.2).
Colors were automatically generated using the k-core algorithm in Pajek.
The factor structures are indicated in the figures using ellipses with dotted
lines; factor designations were provided by the analysts. The number of factors
is reasoned on the basis of screeplots in the respective analyses.
Descriptive statistics
Table 2 provides some descriptive statistics of the three citation
matrices (Scopus 1996-2007, SCI, and SCI 1998-2007). In
addition to the citation indicators, we computed betweenness centralization and
the average clustering coefficients as network measures because these two
indicators teach us about the coherence and the decomposability of the databases,
respectively.
|
|
|
Scopus 2007
(1996-2007)
|
JCR 2007
( - 2007)
|
JCR 2007
(1998-2007)
|
|
a.
|
Number of source journals
|
23,503
|
7,940
|
7,900
|
|
b.
|
Number of source journals (citing)
|
14,964
|
7,925
|
7,793
|
|
c.
|
unique journal-journal relations among source
journals
|
3,570,020
|
1,460,847
|
1,318,180
(= 90.23%)
|
|
d.
|
Total “cited”
|
22,370,409
|
27,477,499
|
|
|
e.
|
Total “citing” (source journals)
|
28,492,874
|
24,979,391
|
16,549,053
|
|
g.
|
Sum journal-journal relations
|
22,370,409
|
24,979,391
|
16,549,053
(= 66.25%)
|
|
h.
|
Average non-zero cell value ( = g/c)
|
6.27
|
17.10
|
12.55
(= 73.39%)
|
|
i.
|
Density
|
0.0065
|
0.0232
|
0.0209
|
|
j.
|
Largest component
|
13,376
(89.4%)
|
7,694
(96.9%)
|
7,674
(97.1%)
|
|
k.
|
Betweenness centralization
|
0.05198
|
0.08354
|
0.08628
|
|
l.
|
Average Clustering Coefficient
|
0.2700429
± 0.1719204
|
0.3478451
± 0.1255273
|
0.3460075
± 0.1289489
|
Table 2: Summary statistics of the three databases
under study.
More detailed analysis of the data revealed that only 14,964
journals of the 23,503 journals with item identifiers included in Scopus
(1996-2007) are processed as source journals (citing). (Only 13,699 were
processed as both cited and citing in 2007.) In the case of the ISI set, the
“All others” category leads to discrepancies between “total cited” (d.) and “total
citing” (e.). The ISI database also contains a large number (292,105) of
non-ISI source journal names among the references, which are in principle
available for further analysis. The huge number of non-source items in Scopus
(2,664,407)9 was not available for analysis. This study focuses on the
24,979,391 unique journal-journal relations among the 7,940 journals in the
case of the ISI and 22,370,409 such relations in the case of Scopus
(boldfaced as line g. in Table 2).
The descriptive statistics for the SCI (1998-2007)
subset are added in the third column of Table 2. The aggregated number of
references to ISI source publications of 1997 or older is 8,430,338.
This amounts to 33.75% of the total of 24,979,391 references included in the
analysis. However, 90.23% of the unique journal-journal relations (c.) in the
full set are also covered by the reduced set. The density (i.) of the reduced
set consequently is not much lower than that of the full set, but the average
non-zero cell value (h.) is. This average may be low in the Scopus
database because of the inclusion of journals with lower citation rates.
The numbers of journal-journal relations are of the same
order in both databases, but the number of journals is larger in the Scopus
database than in the two Science Citation Indices combined. Accordingly,
the density is larger in the ISI database. In other words, the aggregated
journal-journal citation matrix based on the Scopus database contains
many more sparse areas than the ISI database. One would expect that this
difference is caused by the limitation of the Scopus database—reaching
back only to 1996—and the larger number of journals covered. Cutting off the
historical tails of the distributions in the SCI, however, does not have
a large effect on the density which remains in the SCI (1998-2007)
higher than in the Scopus (1996-2007) database.
One should keep in mind that the matrix of citations among
journals in the case of Scopus (1996-2007) is based on aggregation of
citations among identified documents. While the ISI database covers the source
journals cover-to-cover—although it uses only the so-called citable issues
(articles, reviews, letters, and proceedings papers) as the denominator of the
impact factor—Scopus, for example, does not process cited references in
book reviews (Ove Kahler at Scopus, personal communication, 28
August 2009). In other words, the different organization of the Scopus
database may have a large effect that can be expected to vary across fields of
science (Price, 1970).
For example, for the Science Citation Index the
percentage of citations in the historical tail (1997 or older) is 33.16%, while
it is 44.41% for the Social Science Citation Index.
All network measures are lower in the Scopus database than in the ISI
database, but for the latter database it makes not so much difference in terms
of the values of the network measures whether one includes the historical tails
or not. The structural properties of the database are preserved when focusing
only on the later years.
Mapping of journal structures
One would not expect the two databases to be very different
when the focus is on established fields of science and major journals. In order
to test for this baseline, we used two major journals: the Journal of the
American Chemical Society (JACS) and this journal itself—that is, the
Journal of the American Society for Information Science and Technology
JASIST—and compare the resulting visualizations using the parameters as
specified above. Both these journals are major journals in their respective disciplines
and rich sources of citations. JACS had an impact factor of 7.885 in
2007. One of us has analyzed the structure of this journal’s citation
environment in other studies (Leydesdorff, 1991; Leydesdorff & Bensman,
2006). JASIST had an impact factor of 1.436 in 2007. The resulting maps of
the citation environments of this journal may be easier to compare (and
validate) for the readership.
a. The citation impact environment of the JACS.
Figures 1 and 2 show the citation impact environments of the
JACS in the Scopus database and the ISI database, respectively.
In both cases, 18 journals are drawn into the analysis. However, the two lists
of journals are not identical.
Physical Chemistry & Chemical Materials
|
|


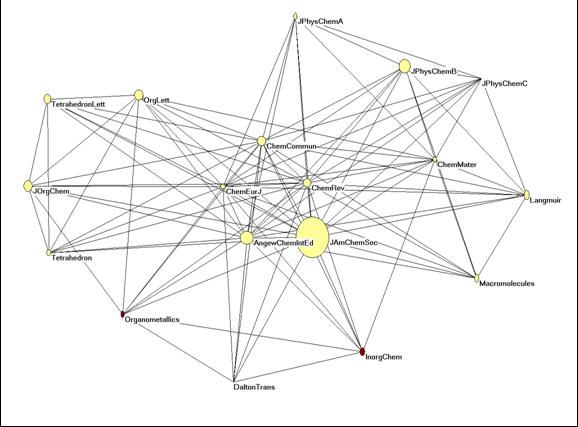
Figure 1: The citation impact environment of the JACS
in Scopus; N = 18; threshold 1%; cosine > 0.2.
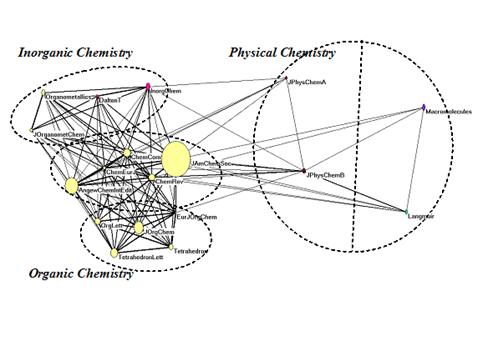
Figure 2: The citation impact environment of the JACS
in the SCI; N = 18; threshold 1%; cosine > 0.2.
Some differences between the two maps are generated because
journals are sometimes included in the one database but not in the other. For
example, the Journal of Physical Chemistry C is not included in the ISI
database; the Journal of Organometallic Chemistry does not pass the
threshold (of 1,831 citations) in Scopus by contributing only 1,512 to
the citations of the JACS.
In both Figures 1 and 2, the main structures can easily be
recognized, but these representations differ significantly in the details.
Factor analysis of both citation matrices provides a similar structure in terms
of four factors explaining 72.9% of the variance in the case of Scopus
and 79.1% in the case of the ISI. In the solution for the ISI database, Langmuir
and Macromolecules are more clearly distinguished from the Journal of
Physical Chemistry A and B, while the case of Scopus, the Journal
of Physical Chemistry C and Chemical Materials were drawn into this
component.
Since other journals are included in both ego-networks, one
percent of the total number of citations will also be different in the two
databases. One would expect this number to be higher in the journal-journal
citation data based on Scopus than in the one based on ISI database
because more journals are included. However, the total number of citations to JACS
is lower (183,186) in the journal-journal citation matrix based on the Scopus
database, and the total number of references in JACS is 77,778,
including 14,985 self-citations. These numbers are 295,465 for citations to JACS
(+ 61.3%), 120,506 references from articles in JACS (+ 54.9%), and
20,706 self-citations (+ 38.2%) in the journal-journal citation data based on
the ISI database (Table 3). The citation frequencies among journals are also
different between the two journal-journal citation matrices. The network in
Figure 1 is accordingly considerably less dense than in Figure 2.
|
JACS
|
Scopus (1996-2007)
|
SCI
(1998-2007)
|
SCI
|
|
Total cited
in ego network
|
183,186
|
73,414
|
295,465
|
|
Total
citing in ego network
|
77,778
|
38,192
|
130,506
|
|
Self-citations
|
14,985
|
14,725
|
20,706
|
Table 3: comparison of cited and citing patterns of JACS in the
three sets.
As noted, the ISI database allows us to select data only for
the last ten years. The number of within journal self-citations for JACS
decreases to 14,725 of the 20,706 citations in the unrestricted case (that is,
71.1%). This is very close to the 14,985 self-citations found in the Scopus
database. Comparison among the columns of Table 3 positions the Scopus
(1996-2007) set between the SCI set and the reduced SCI
(1998-2007) as was to be expected.


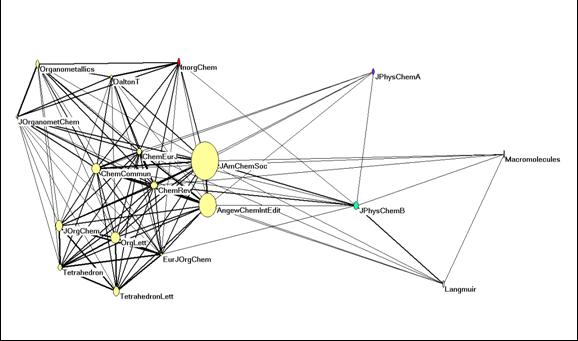
Figure 3: The citation impact environment of the JACS
in the SCI (1998-2007); N = 18; cosine > 0.2.
If we apply the same set of 18 journals used in the full
analysis to the ISI data for 1998-2007, the structure of the data remains
virtually the same (Figure 3). The two citation matrices (with and without the
references to publications older than ten years) correlate with r =
0.978 (p < 0.001). Structure is also maintained: the correlation
between the four-factor matrices with and without the older data is r =
0.993 (p < 0.001). Thus, this ISI data is not structurally affected
by the older data, although they provide a substantial part (29.8% in this
case) of the citations. However, the organization of the factor structure is
different in the case of using the Scopus database (Tables 4 and 5,
respectively). Both the order of the factors and the rank-orders of the
variable loadings within the components are different.
|
|
Component
|
1 |
2
|
3
|
4
|
|
Tetrahedron
|
.938
|
|
|
|
|
Eur J Org Chem
|
.925
|
.179
|
-.117
|
|
|
J Org Chem
|
.922
|
.192
|
-.122
|
|
|
Tetrahedron Lett
|
.916
|
|
|
|
|
Org Lett
|
.891
|
.302
|
-.135
|
|
|
J Am Chem Soc
|
|
.898
|
-.135
|
|
|
Chem Rev
|
.202
|
.879
|
|
.169
|
|
Chem-Eur J
|
.150
|
.864
|
.273
|
|
|
Angew Chem Int Edit
|
.137
|
.787
|
|
-.108
|
|
Chem Commun
|
.154
|
.785
|
.363
|
-.199
|
|
J Organomet Chem
|
|
|
.832
|
|
|
Dalton T
|
-.377
|
.238
|
.807
|
|
|
Organometallics
|
-.204
|
|
.761
|
|
|
Inorg Chem
|
-.360
|
.388
|
.582
|
|
|
J Phys Chem A
|
-.244
|
|
-.225
|
.892
|
|
J Phys Chem B
|
-.514
|
|
-.595
|
.227
|
|
Langmuir
|
-.441
|
|
-.543
|
-.342
|
|
Macromolecules
|
-.351
|
-.213
|
-.369
|
-.461
|
Extraction Method: Principal Component Analysis.
Rotation Method: Varimax with Kaiser
Normalization.
a Rotation converged in 6 iterations.
Table
4: Factor matrix for the citation patterns
among 18 chemistry journals in the citation impact environment of JACS in
2007 using the SCI (1998-2007). Four factors explain 77.6% of the
variance.
|
|
Component
|
1 |
2
|
3
|
4
|
|
Chem Rev
|
.915
|
.237
|
-.103
|
-.152
|
|
J Am Chem Soc
|
.876
|
|
.228
|
-.187
|
|
Chem Eur J
|
.800
|
|
-.320
|
|
|
Chem Commun
|
.782
|
|
-.189
|
.468
|
|
Angew Chem Int Ed
|
.752
|
.277
|
|
.126
|
|
Tetrahedron
|
.148
|
.912
|
-.235
|
|
|
Tetrahedron Lett
|
.114
|
.900
|
-.236
|
|
|
J Org Chem
|
.271
|
.896
|
-.235
|
|
|
Org Lett
|
.346
|
.872
|
-.221
|
|
|
J Phys Chem B
|
|
-.196
|
.853
|
-.241
|
|
J Phys Chem C
|
|
-.141
|
.849
|
-.117
|
|
Chem Mater
|
-.125
|
-.263
|
.807
|
.148
|
|
Langmuir
|
-.269
|
-.137
|
.664
|
|
|
Macromolecules
|
-.406
|
-.132
|
.122
|
|
|
J Phys Chem A
|
|
-.237
|
|
-.877
|
|
Dalton Trans
|
|
-.290
|
-.303
|
.500
|
|
Inorg Chem
|
.486
|
-.515
|
-.231
|
.301
|
|
Organometallics
|
.345
|
-.377
|
-.372
|
.118
|
Extraction Method: Principal Component Analysis.
Rotation Method: Varimax with Kaiser
Normalization.
a Rotation converged in 6 iterations.
Table
5: Factor matrix for the citation patterns
among 18 chemistry journals in the citation impact environment of JACS in
2007 using the Scopus dataset, 1996-2007. Four factors explain 72.9%
of the variance.
Both the figures and the structural components are rather different
among the two databases, while they are not significantly different between the
SCI and the reduced set of SCI (1998-2007). The comparison with Scopus
(1996-2007), however, does not allow us to draw any inferences about which one
of the two representations to choose.
b. JASIST
In the context of this study, JASIST provides us with
an interesting case because one would expect this journal to have suffered from
its name change from JASIS to JASIST in 2001, and perhaps from
the previous name change from American Documentation into JASIS
in 1969. In the case of a name changes, the historical record may not be
carried over to the new name (Bensman & Leydesdorff, 2009).
|
|
Scopus
1996-2007
|
ISI
1998-2007
|
ISI
|
|
Total cited
|
2091
(402)
|
2595
(165)
|
3966
(189)
|
|
JASIS
|
686
(232)
|
0
|
0
|
|
Am Doc
|
0
|
0
|
65
(9)
|
|
Total citing
|
2,843
(575)
|
3,663
(315)
|
5,798
(385)
|
|
Self-citations
|
430
|
588
|
868
|
Table 6: Citations and self-citations of JASIST in the Scopus
and ISI databases, respectively. Italic numbers between brackets indicate the
number of unique journal-journal citation relations involved.
Table 6 shows first that the name change of JASIS into
JASIST affects the Scopus data, but not the ISI data.
The older name of American Documentation can still be retrieved in the
ISI database as a non-source item with 65 references in 2007. While the
difference between the two totals for “cited” can be explained in terms of the cutoff
in the Scopus database before 1996, the difference in “total citing” is
huge. These citations are provided by authors of articles published in JASIST
during 2007: 315 unique journal-journal relations contain 3,663 references in
the SCI 1998-2007 set against 575 unique journal-journal relations which
carry only 2,843 references in the Scopus 1996-2007 set. The lower
number may partly be due to the relative large share of book reviews in the JASIS
previously (Ove Kahler, personal communication, 28 August 2009).
The number of self-citations may vary because of differences
in the respective definitions of citable issues and the time spans under
consideration. The number of self-citations in the ISI database during the last
ten years was 588 (of the 868 self-citations). The number of citations in JASIST
2007 to JASIS in the Scopus database is 133. Thus, we have to
compare the 588 self-citations during the period 1998-2007 in the ISI database against
566 (= 430 + 133) self-citations to the set of both JASIST and JASIS during
the period 1996-2007 in the Scopus database. Given this match, the lower
number of references (“citing”) in the Scopus database, must find its
origin in the differences between the journal sets in the relevant citation
environments of JASIST.
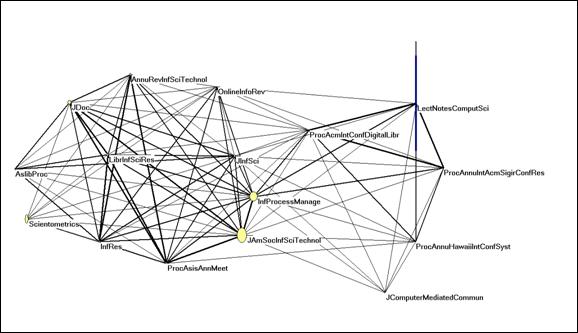
Figure 4: The citation impact environment of JASIST
in the Scopus database; N = 16; threshold 1%; cosine > 0.2.
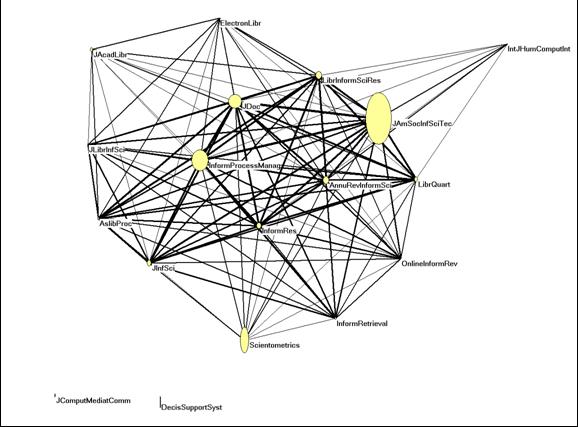
Figure 5: The citation impact environment of JASIST
in the ISI database; N = 18; threshold 0.69%; cosine > 0.2.
The two maps using the full sets (Figures 4 and 5) are very
different. Note that we have adjusted the threshold in the ISI case in
proportion to the different numbers of total citations because of the name
change in 2001 (in accordance with Table 6). With this threshold 18 journals are
selected in the ISI environment as relevant. In the Scopus database, 16
journals are selected. These include a second set of computer science journals
(Figure 4), while the ISI database provides us with a representation of library
and information science as a relatively closed set of journals despite the
lower threshold level (Figure 5).
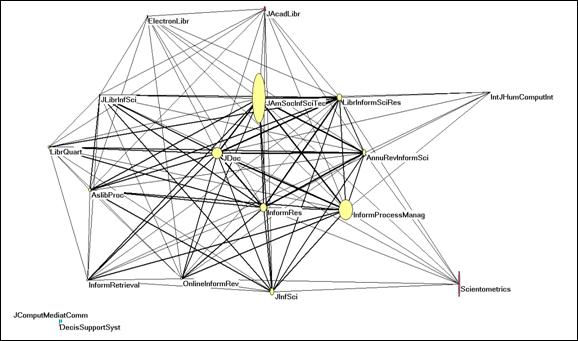
Figure 6: The citation impact environment of JASIST
in the SCI 1998-2007 using the same set as in Figure 5 (including all
citations).
We checked again against the matrix based on the same set of
journals in the ISI database, but using citation data only for the last ten
years (1998-2007). Although this reduces the grand sum of the matrix from 6,075
to 4.233 (69.7%), the two matrices are again virtually identical (r =
0.995; p < 0.001). Figure 6 shows the map for the SCI 1998-2007.
The two figures are marginally different. For example, Scientometrics is
more distanced from the set of information-science journals if older citations
are not taken into account. As noted by Bensman & Leydesdorff (2009), the
citation structure in the ISI database is not significantly affected by
discarding the historical record. The citation structures are reproduced in
this data yearly and can hence be considered as robust.
In summary, the networks in the cores of specialties are
connected in the ISI database more strongly than in the journal-journal
citation matrix based on the Scopus database. This is not because of the
wider casting of the network in the latter case, but because of an erosion of
structure as a consequence of lower average numbers of citations (cf. López-Illesca
et al., 2008). Paradoxically, the maps from the Scopus database may
appear more informative than the ones from the ISI database. The presence of more
relevant environments provides more information in these representations. Using
the ISI data, this same effect should be achievable by using a lower threshold.
In other words, the ISI data is richer in structure than the Scopus data
in this case. This is not caused by the historical record before 1996,
which is available in the JCRs, but not in the Scopus (1996-2007)
data. This historical record is large, but not important for the mapping.
Extension to the humanities
One obvious shortcoming of the ISI databases is the
limitation of the JCRs to the sciences and the social sciences. The Arts
& Humanities Citation Index (A&HCI) does not include a JCR.
One of the promises of the Scopus database is the inclusion of journals
from the humanities. As noted, the recent announcement of the Scopus
team to increase the coverage of journals in the arts and humanities to 3,500
by adding approximately 1,450 top global journals using the European Reference
Index for the Humanities (ERIH) of the European Science Foundation, is not covered
by the current study which uses Scopus data until 2007.3


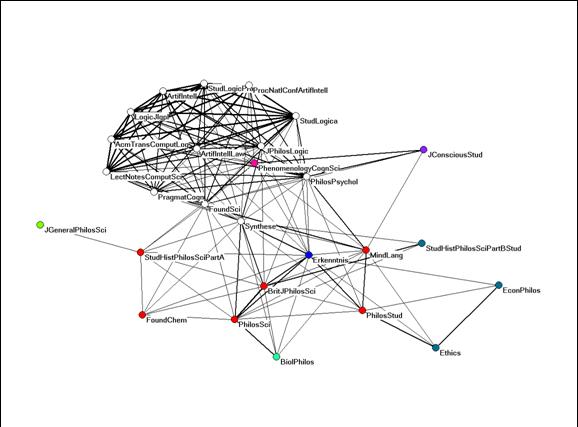
Figure 7: Citation impact environment of Erkenntnis;
N = 32; threshold: 1%; cosine > 0.2.
Is the promise of more coverage than the ISI set in the
social sciences and the arts & humanities fulfilled in the Scopus
1996-2007 set? Using the journal
Erkenntnis as the ego, Figure 7 shows
the citation impact environment of this journal using the same parameters as
before. Thirty-two journals are included. The screeplot suggests a model with four
or five factors. Table 7 shows the four-factor solution.
Rotated
Component Matrix(a)
|
|
Component
|
1 |
2
|
3
|
4
|
|
Acm Trans Comput Log
|
.986
|
|
|
|
|
Logic J Igpl
|
.982
|
|
|
|
|
Lect Notes Comput Sci
|
.980
|
|
|
|
|
Artif Intell
|
.979
|
|
|
|
|
Stud Logic Pract Reasoning
|
.979
|
|
.100
|
|
|
Stud Logica
|
.953
|
|
|
|
|
Proc Natl Conf Artif Intell
|
.946
|
|
|
|
|
Artif Intell Law
|
.828
|
|
|
|
|
J Philos Logic
|
.789
|
.138
|
-.117
|
|
|
Pragmat Cogn
|
.554
|
|
.283
|
|
|
Found Sci
|
.529
|
|
.239
|
-.356
|
|
Philos Sci
|
-.102
|
.871
|
-.124
|
-.173
|
|
Brit J Philos Sci
|
|
.860
|
-.202
|
-.174
|
|
Synthese
|
.241
|
.769
|
|
|
|
Erkenntnis
|
|
.689
|
|
.188
|
|
Biol Philos
|
|
.454
|
|
-.189
|
|
Stud Hist Philos Sci Part B Stud
|
|
.359
|
-.258
|
-.266
|
|
J Radiol
|
|
-.186
|
-.128
|
|
|
European Review
|
|
-.183
|
-.122
|
|
|
Zool Scr
|
|
-.171
|
-.130
|
|
|
J Conscious Stud
|
|
-.103
|
.755
|
-.132
|
|
Phenomenology Cogn Sci
|
.115
|
-.131
|
.748
|
-.241
|
|
Philos Psychol
|
.463
|
.144
|
.737
|
|
|
Mind Lang
|
|
.261
|
.612
|
.349
|
|
J Hist Biol
|
|
-.116
|
-.123
|
-.107
|
|
Ethics
|
-.132
|
|
|
.750
|
|
Econ Philos
|
|
|
-.133
|
.593
|
|
Philos Stud
|
|
.473
|
.229
|
.585
|
|
Stud Hist Philos Sci Part A
|
-.103
|
.142
|
.155
|
-.386
|
|
Found Chem
|
|
.199
|
|
-.300
|
|
J General Philos Sci
|
|
|
|
-.248
|
Extraction Method: Principal Component Analysis.
Rotation Method: Varimax with Kaiser
Normalization.
a Rotation converged in 12 iterations.
Table
7: Four-factor model of the citation
impact environment in the ego-network of Erkenntnis in the Scopus
database, 2007.
Four factors explain 54.8% of the variance. The citation
pattern of Erkenntnis itself loads on a second factor with five other
journals in the philosophy of science. These five other journals are all
included in the Social Science Citation Index. However, three more
journals included in the Scopus database can also be categorized as
philosophy of science (Studies in History and Philosophy of Science Part A,
Foundations of Chemistry, and the Journal for General Philosophy of
Science). These three journals have in common that they load with a
negative sign on factor 4 in Table 7.
Unfortunately, the Scopus (1996-2007) database did not
otherwise contain the rich set of humanities journals that are included in the Arts
and Humanities Citation Index of the ISI. Three journals, for example, had
the word “art” in their title: the International Journal of Art and Design
Education, the American Journal of Art Therapy, and Art Therapy.
The first of these three journals is included in the Social Science Citation
Index; the latter two are not. However, they cannot be considered as art
journals.
A large set of journals (more than 100) containing the word
“art” in their titles are included in the A&HCI. Leonardo, for
example, can be considered as a leading journal for readers interested in the
applications of contemporary science and technology to the arts (Salah &
Salah, 2008). Despite its relative ranking as a C-journal on the lists of the
European Research Index for the Humanities, the journal is included in the A&HCI
but not yet in the Scopus database at the time of this investigation.
The inclusion in the A&HCI provides us with references in this
journal from the citing side. The citations to the journal in the ISI domain
can also be retrieved.
It is less well-known that the all ISI-indexes (including
the A&HCI) allow us to construct a journal citation map from the
cited references in the articles aggregated into journals. The cited reference
field is highly standardized across the three ISI-Indices. For example,
Figure 8 can be constructed using the 3,259 references in the 107 articles which
cited Leonardo in 2008. The aggregate of their reference lists can be
used for a “cited” journal map. Similarly, one can use all references in the
157 articles published in Leonardo in 2008 for a “citing” journal map.
III.Perception Research (9.2%)
|
|
II. Neuropsychology (15.4%)
|
|
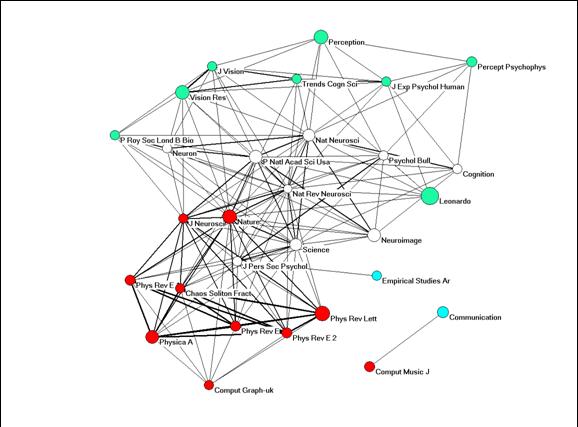
Figure 8: Cosine relations among 3,259 references in 107
articles citing Leonardo during 2008; threshold 0.5%; cosine > 0.2.
Three factors in this case explain 50.3% of the variance. (Since
the organization of the factors does not map in terms of contingent areas in
the cosine-base map, we used colors to indicate the three factors in this case.)
The self-citation pattern of articles in Leonardo citing Leonardo
is attributed to the third factor (designated by us as “perception research”),
but with a factor loading as low as 0.165. Its loading on the “neuro” factor is
negative.
Using this methodology, one can make these maps for all
journals in the three citation indices of the ISI. Since the structure of the
reference patterns in the Scopus database is more complex than the
uniform format in the ISI data, it hitherto is not possible to use Scopus
data for this mapping by aggregating documents. The Scopus data requires
some formatting for an unequivocal translation into the ISI format as used by HistCite™
and other programs.
In summary, the Scopus database enriches our
possibilities to map the arts and humanities because of its larger journal set.
However, the possibilities to map also journals in the Arts & Humanities
Citation Index of the ISI are larger than hitherto exploited. The coverage
of the arts and humanities in the A&HCI was at the time of this
research considerably larger than in the Scopus database.
Extension to
interdisciplinary journals
The extension of the journal set in the Scopus database
allows us to address the position of peripheral journals which could previously
not be addressed. Recently, one of us used citations to non-source journals in
the ISI database to map the position of Science & Public Policy
(Leydesdorff, 2008, p. 283). The Scopus database, however, includes this
journal (Figure 9).
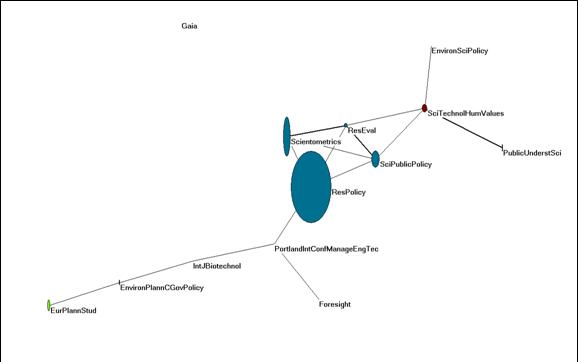
Figure 9: The citation impact environment of Science
& Public Policy in the Scopus database in 2007; N = 13;
threshold: 1%; cosine > 0.2.


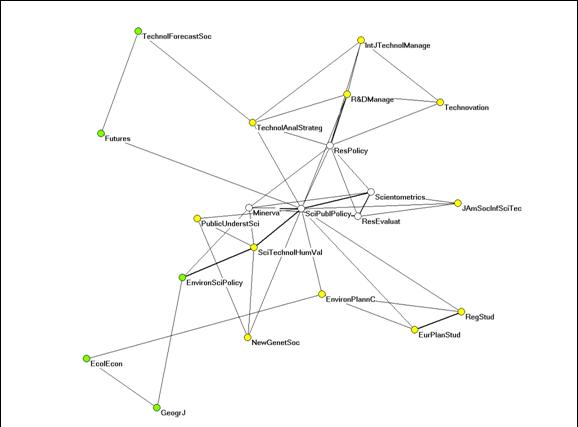
Figure 10: The citation impact environment of Science
& Public Policy in the Social Science Citation Index (1998-2007);
N = 21; threshold: 1%; cosine
> 0.2.
In order to pursue the comparison, let us add in this case
the citation data about Science & Public Policy as a single
non-source journal to the Social SCI (1998-2007). Figure 9 shows an organization
on the basis of the Scopus (1996-2007) database that is very different
from the one possible on the basis of the data in the Social SCI
(1998-2007) in Figure 10.
In both cases, Science & Public Policy connects a
number of journals in science and technology studies. The Scopus
database shows a relatively heterogeneous set connected in a core group, while
Figure 10 provides a more differentiated map of science and technology studies.
Four factors explain 30.1% of the variance in this case,
while in the Scopus case the configuration is to a large extent (18.0%)
defined by the first factor containing the core group which is indicated in
both sets. This core group shows factorial complexity—sometimes used as an
indicator of interdisciplinarity (Leydesdorff & Cozzens, 1993; Van den
Besselaar & Heimeriks, 2001)—in the ISI set.
The function of the interdisciplinary journal connecting
different parts of this field of studies can be made visible in both
representations. In previous studies, the interdisciplinary field of science
and technology studies was found to be so weakly connected that it could no
longer be mapped as integrated using the JCRs of the (Social)
Science Citation Index (Leydesdorff, 2007; Leydesdorff & Van den
Besselaar, 1997; Van den Besselaar, 2000). The addition of interdisciplinary
journals thus shows the cross-connections as relatively weak ties with
potentially important functions. One is more likely to find these journals included
in the Scopus set than in the SCI, but the latter database
allowed in this case for a richer representation by including the interdisciplinary
journal from the list of non-source items.
National subfields
The claim is often made that the ISI databases are not suited
for the evaluation of the social sciences and the humanities because these scholarly
discourses are embedded in national cultures with a specific character.
Hagendijk & Smeenk (1989) introduced the terminology of “national
subfields” for field sciences like ecology, but the point has mainly been made more
emphatically with reference to the specific character of continental European
sociology and philosophy, where the premises are different from those in
American and English literature (Nederhof et al., 1989). The Scopus
database promises to enable us to study these national sets in more detail
using leading journals in the respective cultures. Let us focus on sociology in
Germany and France as relevant examples (Glänzel & Schöpflin, 1999; Yitzhaki,
1998). Because of the potentially low numbers of citations in this field we
included the complete citation impact environments—that is, without using a
threshold—in these cases.

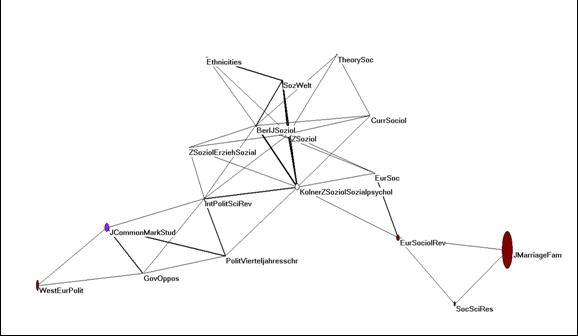
Figure 11: The ego-network of the Zeitschrift für
Soziologie in the Scopus database; N = 17; no threshold;
cosine > 0.2.
Figure 11 provides the representation of the ego-network of
the German Zeitschrift für Soziologie in the Scopus (1996-2007) domain.
The journal is visible in its national context of a core group of journals
in the social sciences in the German language. The international dimension is
connected via the political-science journals involved in the German network, on
the one side, and mainly via the European dimension, on the other. There are no
citation relations to the leading American journals in this (“being cited”) direction.

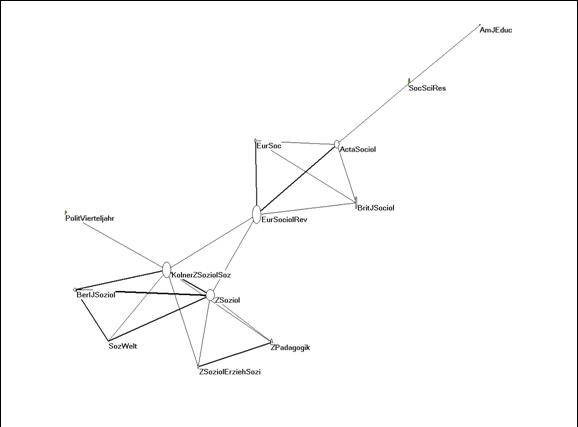
Figure 12: The citation impact environment of the Zeitschrift
für Soziologie in the Social Science Citation Index 1998-2007; N
= 13; no threshold; cosine > 0.2.
The Zeitschrift für Soziologie is also included in
the Social Science Citation Index. Figure 12 provides the map of its
ego-network in this database when the historical tail is removed (SCI
1998-2007). Adding the tail makes only a single additional relation visible between
the British Journal of Sociology and the British Journal of Sociology
of Education, and the network then is a bit denser. Although rather
different again, the map based on the Scopus data seems to outperform
the map based on the SCI even if the latter is not restricted to the
1998-2007 period.
In France, the national tradition in sociology is more
integrated with the Anglosaxon literature than in Germany. Several (e.g.,
Canadian) journals accept manuscripts in both languages. A leading journal in
French sociology—initiated by Pierre Bourdieu in 1975—is Actes de Recherche
en Sciences Sociales. This journal belongs to the group of journals not
cited in the Scopus database, but it is included in the Social
Science Citation Index 2007. According to the Scopus
database, Actes de Recherche en Sciences Sociales contains seven references
during 2007 as against 766 references according to the Social Science
Citation Index for that same year. Actes de Recherche en Sciences
Sociales, however, had an impact factor of 0.074 in 2007.
A journal in French sociology which is included in both
databases is the Revue Française de Sociologie with an impact factor
2007 of 0.222. We used this journal for the comparison. Figure 13 provides the
map for the Scopus 1996-2007 data and Figure 14 for the complete set in
the Social Science Citation Index. The restricted set in this case
provides a map even poorer than Figure 14 (based on the full SCI data),
while the latter is still outperformed by the one based on the Scopus (1996-2007)
database in Figure 13.

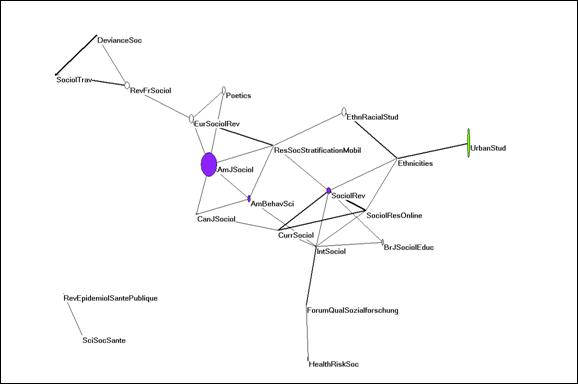
Figure 13:
Complete citation impact environment of the Revue Française de Sociologie
in the Scopus database 1996-2007 ; no threshold ; cosine >
0.2.

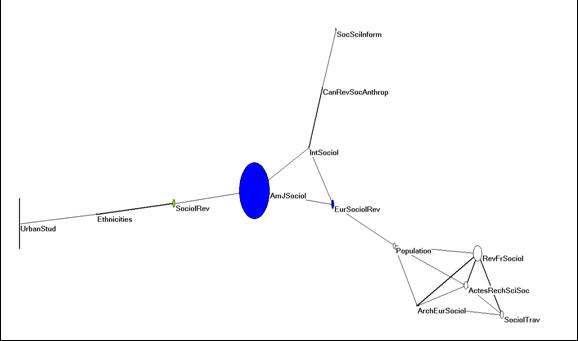
Figure 14:
Complete citation impact environment of the Revue Française de Sociologie
in the Social Science Citation Index (all years); no threshold ;
cosine > 0.2.
Both figures show that the French sociological tradition is
less distanced from the Anglosaxon discourse than the German one. In both the
French and German cases, the maps made on the basis of the Scopus data
outperform the ones on the basis of the Social Science Citation Index.
Because of this focus on the social sciences, one would perhaps expect the
historical tails of the distributions (in the Social Science Citation Index)
to be more influential than they are. In other words, the loss of the tail in
the Scopus database is more than compensated by the wider reach of this
database.
Non-scholarly journals and
newspapers
The New York Times, Washington Post, and the Wall
Street Journal can be analyzed in terms of their citation patterns in the
ISI database using the non-ISI source references. However, the journal names
and abbreviations are not standardized in this list. In the Scopus
database, these names are standardized, but as in the case of the ISI the
newspapers are not processed in terms of their citing references but registered
only when they are cited in the Scopus domain.
There are only few citations to newspapers in the matrix
based on the Scopus database (e.g., 43 to the NY Times and 14 to
the Wall Street Journal), because newspapers are not among the source
journals. In contrast, the Wall Street Journal was cited 2,196 times by
354 source journals of the ISI databases in 2007. (This newspaper is mostly
cited in law review journals.) However, neither database allows for systematic
research at the interfaces between scholarly communication and newspapers.
Citation relations are typical for the scientific domain; co-word analysis
among titles or full texts may be a better tool if one is interested in
analyzing developments at the interfaces of scientific communication (Callon et
al., 1986; Leydesdorff & Hellsten, 2005).
Conclusions and discussion
By providing aggregated journal-journal citation data, both Scopus
and the ISI databases enable us to map journals and to delineate specialties,
while this cannot easily be done using Google Scholar. As is well known,
the coverage of journals by Scopus is larger than by the ISI. Since the
core groups of scholarly journals are to a large extent the same, Scopus
can be expected to provide mainly an enlargement when compared with the ISI
set. One can expect that the added journals are more peripheral, and that the
added networks will thus be less dense than those among core journals
(López-Illescas et al., 2008).
In addition to this effect, the journal-journal citation matrix
based on the Scopus data contains sometimes fewer citations to and
references from individual journals than the one based on ISI data. Although the
aggregations under the category “All others” have a considerable effect in the
latter database, even after correction for this category, the numbers in the
ISI database tend to remain higher than in the Scopus (1996-2007) database.
The matrix based on Scopus is not only sparser but also less pronounced
in terms of the values in the cells. Although this may significantly affect the
analysis, a user may feel well served with a map showing a less pronounced, but
wider net.
One major difference between the two databases is the
inclusion of citations from the historical record in the ISI database, while
the Scopus database begins only in 1996. We noted that this historical
record is of the order of more than 30%, although this can be expected to vary
among fields of science. In the case of the ISI database, the historical record
is also reorganized in the event of a name change of a journal, but this
affects the structure present in the database only marginally (Bensman &
Leydesdorff, 2009). Otherwise, the citation structure is continuously
reproduced and updated by the JCRs. The differences with the matrix
based on the Scopus database find their origin in other rules for the
inclusion of citations during the period covered by the database.
The extension of Scopus to include journals in the
humanities could provide us with a new opportunity as long as a JCR for
the A&HCI is missing. Figure 7 provided a journal map for a
philosophical domain (using Erkenntnis as a source journal) which one cannot
make with the ISI databases. Similarly, a large number of journals are
processed by Scopus which are not processed by the ISI. We took Science
& Public Policy as an example. Since these journals relate in
relatively sparse parts of the network, inclusion of their relatively “weak
ties” may provide new perspectives on the data (Granovetter, 1982).
In the case of Science & Public Policy, for
example, a specific coherence among journals in the area of Science &
Technology Studies can be revealed which cannot so easily be found using the
ISI set. Scientometrics, for example, is firmly embedded in another
cluster of journals—that is, library and information science—in the latter
database. However, a relevant map could also be provided about the journal
structures in this case using the references to non-source items in the ISI
data. It seems worth the additional effort to use this ISI data in such cases. With
some additional effort, journals in the arts and humanities can also be mapped
in terms of aggregated journal-journal citations directly from the Arts
& Humanities Citation Index.
Within the social sciences, it is common to complain about the
inaptness of the American-based citation indices for the evaluation of
nationally oriented cultural analyses such as those published in sociology
journals in the respective languages. Does the wider coverage of Scopus
solve this problem? In the case of leading journals in German sociology, we found
the two databases to point in different directions, but both indicated a
prevailing isolation of this tradition in terms of its being-cited patterns.
The French tradition is less isolated and better perceived in main-stream
sociological research, notably in the UK. This becomes better visible using the
Scopus data than the SCI data.
Let us repeat that both databases do a fine job in providing
source materials for the mapping of science. Some of the differences that are
being shown in this paper are a result of the differences in maturity of the
two databases. The ISI data are more mature in that the ISI has had decades
longer to develop cleaning, standardization, and normalization procedures that
show up in the raw data and JCR. The Scopus data are newer, and thus less clean
(despite unique item identifiers) and less standardized in the cited references.
However, the competition between the two may lead to further improvements such
as the recent extension of the ISI database with 700 regional journals.
Improvements in the Scopus database could focus on covering the source
materials more systematically. As noted, a further extension of the coverage of
journals in the arts and humanities was recently realized.
Acknowledgement
We are grateful for Almila Salah for her advice about using
the Arts & Humanities Citation Index for the purpose of journal
mapping. We are also grateful to an anonymous referee who provided us with additional
information about the Scopus database.
References:
Ahlgren, P.,
Jarneving, B., & Rousseau, R. (2003). Requirement for a Cocitation
Similarity Measure, with Special Reference to Pearson’s Correlation
Coefficient. Journal of the American Society for Information Science and
Technology, 54(6), 550-560.
Bar-Ilan, J.
(2008). Which h-index?—A comparison of WoS, Scopus and Google Scholar. Scientometrics,
74(2), 257-271.
Bensman,
S. J., & Leydesdorff, L. (2009). Definition and Identification of
Journals as Bibliographic and Subject Entities: Librarianship vs. ISI Journal
Citation Reports (JCR) Methods and their Effect on Citation Measures. Journal
of the American Society for Information Science and Technology, 60(6),
1097-1117.
Callon, M., Law,
J., & Rip, A. (Eds.). (1986). Mapping the Dynamics of Science and
Technology. London: Macmillan.
De Looze, M.-A.,
R.Cronini, M. Legentil, Jeannin, P., & Magri, M.-H. (1996). Determining the
Core of Journals of a Research Centre: The Example of Researchers from the
Department of Rural Economy and Sociology of the Institut National de la
Recherche Agronomique, France. Scientometrics, 36(2), 167-183.
De
Moya-Anegón, F., Vargas-Quesada, B., Chinchilla-Rodríguez, Z., Corera-Álvarez,
E., Munoz-Fernández, F. J., & Herrero-Solana, V. (2007). Visualizing
the marrow of science. Journal of the American Society for Information
Science and Technology, 58(14), 2167-2179.
Garfield, E.
(1972). Citation Analysis as a Tool in Journal Evaluation. Science 178(Number
4060), 471-479.
Garfield, E.
(1979). Citation Indexing: Its Theory and Application in Science,
Technology, and Humanities. New York: John Wiley.
Garfield, E.
(1990). How ISI selects Journals for Coverage: Quantitative and Qualitative
Considerations. Current Contents(28 May), 5-13.
Garfield, E.
(1998). Journal Impacts as Surrogates. Paper presented at the 41st
Annual Meeting of the Council of Biology Editors, Salt Lake City, UT.
Glänzel, W.,
& Schoepflin, U. (1999). A bibliometric study of reference literature in
the sciences and social sciences. Information Processing and Management, 35(1),
31-44.
Granovetter, M.
S. (1982). The strength of weak ties. A network theory revisited. In P. V.
Marsden & N. Lin (Eds.), Social structure and network analysis (pp.
105-130.). London/New York: Sage.
Hagendijk, R. P.,
& Smeenk, J. W. (1989). The analysis of national subfields: a case study of
Dutch fresh-water ecology. Scientometrics, 15(5), 485-508.
Jacso, P. (2005).
As we may search–comparison of major features of the Web of Science, Scopus,
and Google Scholar citation-based and citation-enhanced databases. Current
Science, 89(9), 1537-1547.
Jacso, P. (2008).
Testing the calculation of a realistic h-index in Google Scholar, Scopus, and
Web of Science for FW Lancaster. Library Trends, 56(4), 784-815.
Jin, B.,
Jiangong, Z., Chen, D., & Zhu, X. (2002). Development of Chinese
Scientometric Indicators (CS). Scientometrics, 54(1), 145-154.
Jin, B., &
Leydesdorff, L. (2004). A Comparison of the Aggregated Journal Citation
Structures in the Chinese Science Citation Database and the Science Citation
Index. Paper presented at the Eighth International Conference on Science
and Technology Indicators, Leiden, 23-25 September.
Klavans, R.,
& Boyack, K. (2007). Is there a Convergent Structure of Science? A
Comparison of Maps using the ISI and Scopus Databases. Proceedings of the
11th International Conference of Scientometrics and Informetrics, D.
Torres-Salinas & H. Moed (Eds.), Vol. 1, pp 437-448, CSIC, Madrid, 21-25
June 2007.
Klavans, R.,
& Boyack, K. (2009). Towards a Consensus Map of Science, Journal of the
American Society for Information Science and Technology, 60(3), 455-476.
Klavans, R.,
& Boyack, K. (2009). Towards a Consensus Map of Science Journal of the
American Society for Information Science and Technology, 60(3), 455-476.
Klavans, R.,
& Boyack, K. W. (2009). Identifying Distinctive Competencies in Science. Journal
of Higher Education, under submission.
Leydesdorff, L.
(1991). The Static and Dynamic Analysis of Network Data Using Information
Theory. Social Networks, 13, 301-345.
Leydesdorff, L.
(1994). The generation of aggregated journal-journal citation maps on the basis
of the CD-ROM version of the Science Citation Index. Scientometrics, 31(1),
59-84.
Leydesdorff, L.
(2007). Mapping Interdisciplinarity at the Interfaces between the Science
Citation Index and the Social Science Citation Index. Scientometrics,
71(3), 391-405.
Leydesdorff, L.
(2008). Caveats for the Use of Citation Indicators in Research and
Journal Evaluation. Journal of the American Society for Information Science
and Technology, 59(2), 278-287.
Leydesdorff,
L., & Bensman, S. J. (2006). Classification and Powerlaws: The
logarithmic transformation. Journal of the American Society for Information
Science and Technology, 57(11), 1470-1486.
Leydesdorff, L.,
& Cozzens, S. E. (1993). The Delineation of Specialties in Terms of
Journals Using the Dynamic Journal Set of the Science Citation Index. Scientometrics,
26, 133-154.
Leydesdorff, L.,
& Hellsten, I. (2005). Metaphors and Diaphors in Science Communication:
Mapping the Case of ‘Stem-Cell Research’. Science Communication, 27(1),
64-99.
Leydesdorff, L.,
& Jin, B. (2005). Mapping the Chinese Science Citation Database in terms of
aggregated journal-journal citation relations. Journal of the American
Society for Information Science and Technology, 56(14), 1469-1479.
Leydesdorff, L.,
& Rafols, I. (2009). A Global Map of Science Based on the ISI Subject
Categories. Journal of the American Society for Information Science and
Technology, 60(2), 348-362.
Leydesdorff,
L., & Van den Besselaar, P. (1997). Scientometrics and Communication
Theory: Towards Theoretically Informed Indicators. Scientometrics, 38,
155-174.
Leydesdorff, L.,
& Wagner, C. S. (2009). Macro-level Indicators of the Relations between
Research Funding and Research Output in preparation.
López-Illescas,
C., de Moya-Anegón, F., & Moed, H. F. (2008). Coverage and citation impact
of oncological journals in the Web of Science and Scopus. Journal of
Informetrics, 2(4), 304-316.
Maricic, S.
(1997). The mainstream-peripheral science communication. Technoscience, 10
(Winter 1997, at http://cybermetrics.cindoc.csic.es/cybermetrics/pdf/394.pdf).
Meho, L. I.,
& Rogers, Y. (2008). Citation counting, citation ranking, and h-index of
human-computer interaction researchers: A comparison between Scopus and Web of
Science. Journal of the American Society for Information Science and
Technology, 59(11), 1711–1726.
Meho,
L. I., & Yang, K. (2007). Impact of data sources on citation counts
and rankings of LIS faculty: Web of science versus scopus and google scholar. Journal
of the American Society for Information Science and Technology, 58(13),
2105-2125.
Moed, H. F.
(2002). Measuring China’s research performance using the Science Citation
Index. Scientometrics, 53(3), 281-296.
Narin, F.,
Carpenter, M., & Berlt, N. C. (1972). Interrelationships of Scientific
Journals. Journal of the American Society for Information Science, 23,
323-331.
Nederhof, A. J.
(2006). Bibliometric monitoring of research performance in the social sciences
and the humanities: A review. Scientometrics, 66(1), 81-100.
Nederhof,
A. J., Zwaan, R. A., Bruin, R. E., & Dekker, P. J. (1989). Assessing
the usefulness of bibliometric indicators for the humanities and the social
sciences: A comparative study. Scientometrics, 15, 423-436.
Price, D. J. de Solla
(1961). Science since Babylon. New Haven: Yale University Press.
Price,
D. J. de Solla (1965). Networks of scientific papers. Science, 149,
510- 515.
Price,
D. J. de Solla (1970). Citation Measures of Hard Science, Soft Science,
Technology, and Nonscience. In C. E. Nelson & D. K. Pollock (Eds.), Communication
among Scientists and Engineers (pp. 3-22). Lexington, MA: Heath.
Rafols, I., & Leydesdorff, L. (2009). Content-based and Algorithmic Classifications of
Journals: Perspectives on the Dynamics of Scientific Communication and Indexer Effects
Journal of the American Society for Information Science and Technology, In
print; DOI: 10.1002/asi.21086.
Ren, S., &
Rousseau, R. (2002). International visibility of Chinese scientific journals. Scientometrics,
53(3), 389-405.
Rosvall, M.,
& Bergstrom, C. T. (2008). Maps of random walks on complex networks reveal
community structure. Proceedings of the National Academy of Sciences, 105(4),
1118-1123.
Salah, A. A. A.,
& Salah, A. A. (2008). Technoscience art: A bridge between neuroesthetics
and art history? Review of General Psychology, 12(2), 147-158.
Sivertsen, G. (2003). Bibliografiske datakilder til
dokumentasjon av vitenskapelige publikasjoner. Oslo: NIFU skriftserie nr.
22/2003; at http://www.nifustep.no/norsk/publikasjoner/bibliografiske_datakilder_til_dokumentasjon_av_vitenskapelige_publikasjoner, 89.
Testa, J. (1997).
The Thomson Scientific Journal Selection Process [online]. Available
at http://www.thomsonreuters.com/business_units/scientific/free/essays/journalselection/.
Van den Besselaar, P. (2000). Communication between Science
and Technology Studies journals. Scientometrics, 47, 169-193.
Van
den Besselaar, P., & Heimeriks, G. (2001). Disciplinary,
Multidisciplinary, Interdisciplinary: Concepts and Indicators. 8th
International Conference on Scientometrics and Informetrics (ISSI2001), M.
Davis & C. S. Wilson (Eds.), 705-716. Sydney: University of New South-Wales.
Van
Leeuwen, T. N., Moed, H. F., Tijssen, R. J. W., Visser, M. S., & Van Raan,
A. F. J. (2001). Language biases in the coverage of the Science Citation
Index and its consequencesfor international comparisons of national research
performance. Scientometrics, 51(1), 335-346.
Yitzhaki, M.
(1998). The ‘language preference’ in sociology: Measures of ‘language
self-citation’,‘relative own-language preference indicator’, and ‘mutual use of
languages’. Scientometrics, 41(1), 243-254.