Should Co-occurrence Data be Normalized?
A Rejoinder to: Waltman, L., & Van Eck, N. J. (2007). Some comments on the question whether co-occurrence data should be normalized.
Journal of the American Society for Information Science and Technology, forthcoming.
Loet Leydesdorff
Amsterdam School of Communications Research (ASCoR), University of Amsterdam
Kloveniersburgwal 48, 1012 CX Amsterdam, The Netherlands
1. The argument
Our argument was analytical, and not only based on the visualizations. For example in the dataset under study, Ahlgren et al. (2003, at p. 556) found a correlation of r = + 0.74 between “Schubert” and “Van Raan,” while Leydesdorff & Vaughan (at p. 1620) report r = – 0.131 (p < 0.05) using the underlying (and asymmetrical) citation matrix. The difference can be explained by the generation of spurious correlations between the co-cited items.
One can calculate from Table 7 of Ahlgren et al. (2003, at p. 555) that the margintotal of co-citations of these two authors was 139 and 138, respectively. However, these numbers are based on only 60 and 50 citations, respectively. In other words, these authors are heavily co-cited with their collaborators in this network, and thus the total number of co-citations for them is more than twice the number of citations. This “double counting” of co-citations generates spurious correlations when the co-occurrence matrix is used for the normalization instead of the occurrence matrix. The asymmetrical citation matrix contains more information than the symmetrical co-occurrence matrix. The latter can be generated from the former, but an attribute matrix cannot be generated from a co-occurrence matrix because information is lost during the transformation.[1]
Waltman & Van Eck (2007; hereafter W&vE) did not distinguish sufficiently between these two matrices when they formulated: “In order to correct for the differences in the number of times authors are cited, cocitation matrices should be normalized, for example using the Pearson correlation.” It does not follow from the differences in the number of times authors are cited, that cocitation matrices should be normalized. If one wishes to show the similarities between authors, author attributes should be normalized (Burt, 1982; Schneider & Borlund, forthcoming).
In the web environment, the approach of retrieving first citation data is often not feasible. In that case, the normalization of co-citation matrices should not be based on the Pearson correlation or the cosine, but on the Jaccard index (Small, 1973; Luukkonen et al., 1993) or on probabilistic measures which normalize observed cell values against expected ones (Michelet, 1988; Zitt, 2000). Unlike the Pearson correlation or the cosine, the latter measures do not use the information contained in the distributions but only the cell values and the margintotals of the subsets (Leydesdorff, in preparation).
2. The Mappings
Using the new version of SPSS 14.0.1, W&vE are “indecisive” with respect to the choice between citation or co-citation data as input to the Pearson correlation analysis.[2] Since our universities did not yet receive the latest updates of SPSS 14.0.1 and this discussion is only about symmetrical matrices, we can use the algorithm of Kamada & Kawai (1989) as available in Pajek. Unlike a multidimensional scaling program (e.g., PROXSCAL), this network program enables us not only to position the nodes, but also to visualize and appreciate the links. The procedure is otherwise analogous to non-metric multi-dimensional scaling: the network is represented as a system of springs with relaxed lengths proportional to the edge length. Nodes are iteratively repositioned to minimize the overall ‘energy’ of the spring system using a steepest descent procedure.
W&vE’s argument is based on the Pearson correlations provided in Table 9 of Ahlgren et al. (2003, at p. 556). This correlation matrix is extremely structured: it contains exclusively positive correlations within both groups and negative correlations between the two groups. The two groups are thus completely separated in terms of the Pearson correlation coefficients. A representation should reflect this complete separation. Both Figure 12 of LV and the improved Figure 2 of W&vE fail to do so. On the basis of precisely the same Pearson correlation matrix, the following figure can be generated using Pajek:
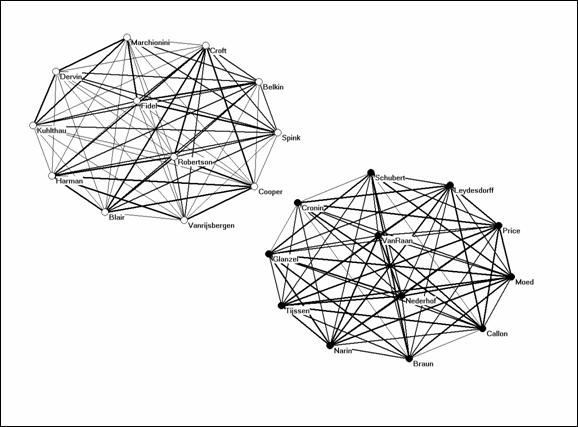
Figure 1: Two clusters based on Table 9 of Ahlgren et al. (2003).
Figure 1 shows the two graphs as separated. This is a much better representation of this matrix than either Figure 2 of W&vE or Figure 12 of LV. The negative Pearson correlation values between the two groups are fully appreciated. In terms of these Pearson correlations, the network among the scientometricians is denser than the one among the authors specialized in information retrieval. As argued, this apparent density is due to spurious correlations because of co-authorship relations: some of the correlations within the scientometric group were negative when the analysis was based on the asymmetrical citation matrix.
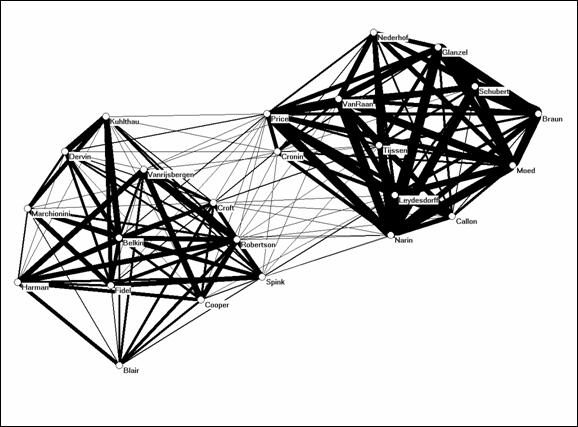
Figure 2: Visualization of the co-citation matrix provided by Ahlgren et al. (2003; at p. 555, Table 7).
Figure 2 is based on the non-normalized co-occurrence data as provided by Ahlgren et al. (2003, at p. 555) as Table 7. This figure shows that the two groups are not completely separated in terms of the observed data. The two strong components of Figure 1 belong to a single graph, and by using this representation the scholars working at the interface can also be identified (e.g., by using betweenness centrality; Wasserman & Faust, 1994). In our opinion, Figure 2 improves on both Figure 1 above and Figure 2 of W&vE.
In summary: if one is interested in the position of authors (actors) or institutes (aggregates of actors) in networks of relations, these authors should preferentially be considered as the units of analysis (to which relations are attributed). A relation is a unit of analysis different from a node at a position (Burt, 1982). Using multidimensional scaling or factor analysis, one can search for the latent dimensions in the attribute data.
The co-occurrence matrix informs us about the relations among the actors, and positions the nodes from the perspective of optimizing the graph of their relations (e.g., by using the metaphor of a system of springs). Graph analysis is accordingly different from factor analysis (Leydesdorff, 2004). We have shown that this change in the system of reference can have dramatic effects on the size and sign of the Pearson correlation coefficient. The problem is akin to the ecological fallacy which may lead to a change in the sign of the regression coefficient when the level of aggregation is changed (Robinson, 1950; Kreft & De Leeuw, 1988).
Acknowledgement
I am grateful to Liwen Vaughan for comments.
References:
Ahlgren, P., Jarneving, B., & Rousseau, R. (2003). Requirement for a Cocitation Similarity Measure, with Special Reference to Pearson's Correlation Coefficient. Journal of the American Society for Information Science and Technology, 54(6), 550-560.
Borgatti, S.P., Everett, M.G., & Freeman, L.C. (2002). Ucinet 6 for Windows. Harvard: Analytic Technologies.
Burt, R. S. (1982). Toward a Structural Theory of Action. New York, etc.: Academic Press.
Kamada, T., & Kawai, S. (1989). An algorithm for drawing general undirected graphs. Information Processing Letters, 31(1), 7-15.
Kreft, G. G., & De Leeuw, E. D. (1988). The See-Saw Effect: A multilevel problem. Quality and Quantity, 22(2), 127-137.
Leydesdorff, L. (2004). Top-down Decomposition of the Journal Citation Report of the Social Science Citation Index: Graph- and factor-analytical approaches. Scientometrics, 60(2), 159-180.
Leydesdorff (in preparation). The Normalization and Visualization of Author Co-Citation Data (under submission).
Leydesdorff, L., & Vaughan, L. (2006). Co-occurrence Matrices and their Applications in Information Science: Extending ACA to the Web Environment. Journal of the American Society for Information Science and Technology, 57(12), 1616-1628.
Luukkonen, T., Tijssen, R. J. W., Persson, O., & Sivertsen, G. (1993). The Measurement of International Scientific Collaboration. Scientometrics, 28(1), 15-36.
Michelet, B. (1988). L’analyse des associations. Unpublished Ph. D. Thesis, Université Paris VII, Paris.
Robinson, W. D. (1950). Ecological correlations and the behavior of individuals. American Sociological Review, 15, 351-357.
Small, H. (1973). Co-citation in the Scientific Literature: A New measure of the Relationship between Two Documents. Journal of the American Society for Information Science, 24(4), 265-269.
Schneider, J. W., & Borlund, P. (forthcoming). Matrix comparison, Part 1: Motivation and impartant issues for measuring the resemblance between proximity measures and ordination results. Journal of the American Society for Information Science and Technology.
Waltman, L., & Van Eck, N. J. (2007). Some comments on the question whether co-occurrence data should be normalized. Journal of the American Society for Information Science and Technology, forthcoming.
Wasserman, S., & Faust, K. (1994). Social Network Analysis: Methods and Applications. New York: Cambridge University Press.
Zitt, M., Bassecoulard, E., & Okubo, Y. (2000). Shadows of the past in international cooperation: Collaboration profiles of the top five producers of science. Scientometrics, 47(3), 627-657.
[1] One can obtain a symmetrical matrix by multiplying an asymmetrical one with its transposed. Two symmetrical matrices are possible. Borgatti et al. (2002) formulate this (in the manual of UCINet) as follows: “Given an incidence matrix A where the rows represent actors and the columns events, then the matrix AA' gives the number of events in which actors simultaneously attended. Hence AA' (i,j) is the number of events attended by both actor i and actor j. The matrix A'A gives the number of events simultaneously attended by a pair of actors. Hence A'A(i,j) is the number of actors who attended both event i and event j.”
[2] We chose PROXSCAL only because this program enabled us to make comparisons between symmetrical and asymmetrical matrices.