1.
Introduction
An increasing share of scientific
papers is co-authored by scientists from two or more nations. During the
1990s, a rapid rise occurred in internationally co-authored papers indicating a
rise in collaboration (Doré et al., 1996; Georghiou, 1998; Glänzel,
2001). The increase was dramatic: international collaborations (as measured by
internationally co-authored publications) doubled (Wagner & Leydesdorff,
2005a). The increase can be seen across all fields of science at more or less
the same rate (Wagner, 2005). Collaboration continued to rise in the early
2000s. The number of internationally co-authored articles grew at a rate
faster than traditional “nationally-co-authored” articles (NSB, 2002).
Moreover, internationally co-authored articles appear to be cited more often
than nationally co-authored papers (Narin, 1991; Persson et al., 2004).
We suggest that international
collaboration in science can be considered as a communications network that is different
from national systems and has its own internal dynamics (Gibbons et al.,
1994; Price, 1963; Ziman, 1994; Katz & Hicks, 1998; Wagner, forthcoming; Wagner
& Leydesdorff, 2005b). National systems have policies and institutions
that mediate scientific communication, while at the global level the network exists
primarily as a self-organizing system. The exception here is the European
Union, where specific incentives exist to encourage formal international
linkages among member countries. Does the EU emerge as an “international
actor” or are different patterns (e.g., elite structures including the USA) more dominant?
2. Data and methodology
Data were harvested from the CD-Rom
version of the Science Citation Index for articles, reviews, letters,
and notes for 1990, 2000, and 2005.
In his study entitled Evaluative Bibliometrics, Narin (1976) proposed counting
only articles, reviews, and notes as indicators of scientific performance.
Braun et al. (1989) argued in favor of including letters as scientific
output. However, the Institute for Scientific Information (ISI) no longer registered
for the category of “notes” after 1995. We included 3,090 internationally
coauthored notes in the counts for 1990 because the data was already organized
in this format during a previous project. Table 1 provides an overview of the
data for the three years in question.
|
Year
|
(1)
Nr of articles, reviews, letters, and notes
|
(2)
Nr of addresses in documents in (1)
|
(3)
Nr of authors in documents in (1)
|
(4)
Internationally coauthored documents (a+r+l+n)
|
(5)
Nr of addresses in (4)
|
(6)
% Internationally coauthored documents
|
|
1990
|
508,941
|
908,783
|
1,866,821
|
51,596
|
147,411
|
10.1
|
|
2000
|
623,111
|
1,432,401
|
3,060,436
|
121,432
|
398,503
|
19.4
|
|
2005
|
734,750
|
1,696,042
|
3,301,251
|
171,402
|
618,928
|
23.3
|
Table 1. Data on international collaboration
comparing four years: 1990, 2000, and 2005.
For example, of the 1,011,363 records contained in the Science
Citation Index 2005, only the 734,750 articles, reviews, and letters were
considered. Among these documents, 171,402 were internationally coauthored;
this is 23.3% of the total in column (1).
Collaboration was indicated by a
co-authorship event at the document level. The country counts were done using
integer counting, which attributes a count of “1” to each occurrence of
authorship from a country among the set.
This leads to an asymmetrical matrix of documents versus countries. The cosines
are computed on the basis of this matrix (Leydesdorff, 1989; Leydesdorff &
Vaughan, 2006).
Since the distributions are not
expected to be normal, it has been suggested that the cosine instead of the
Pearson correlation is the proper measure for normalization (Ahlgren et al.,
2003; Boyack et al., 2005; cf. Hamers et al., 1989). The cosine
normalizes to a geometric mean (rather than an arithmetic mean) and the
consequent vector space model (Salton & McGill, 1983) is useful for the
visualization of latent structures in the set. Since the cosine runs from zero
to one, a very small number of relations can be expected to generate a cosine
larger than zero. We considered cosine > 0.01 as a relevant threshold for
discarding this incidental variation. Incidental variations may be caused by
ongoing relations between supervisors and students or postdocs who have
returned to their home countries.
The co-authorship events were additionally placed into a
symmetrical matrix where country names appear on both axes, with the number of
co-occurrence events appearing in the corresponding cell. Normalization,
however, was based on the asymmetrical occurrence matrix because this matrix
contains all information at the document level, including co-authorship
relations among more than two countries. Leydesdorff & Vaughan (2006)
showed that using the symmetrical co-occurrence matrix—which is based on
multiplication of the asymmetrical occurrence matrix with its transposed—may
lead to faulty conclusions about the underlying structure because information
is lost. For example, correlations among co-occurrences can be spurious when
based on multilateral co-occurrences at the document level (Waltman & Van
Eck, 2007; Leydesdorff, 2007a).
Both the co-occurrence and the
normalized tables were used to conduct network analysis using UCINET and Pajek
software (De Nooy et al., 2005). The normalized data can reveal structures
such as resemblances in patterns which in non-normalized data are overshadowed
by the effect of stars in the network with a high degree of centrality (e.g.,
the USA; Leydesdorff, 2007b). The results are presented below.
3. Results
Figure 1 visualizes the growth in
international collaboration on the basis of the data provided in Table 1 above.
The number of internationally coauthored publications has grown linearly (r2 >
0.99). However, Figure 1 shows an exponential growth in the number of addresses
of internationally collaborating authors (r2 >
0.99), suggesting that the growth of the network extends to many more places
around the globe, with a corresponding growth in the possibility of knowledge
diffusion. The average number of addresses in any one internationally coauthored
publication has grown from an average of 2.86 in 1990 to 3.61 in 2005, and this
trend is accelerating.
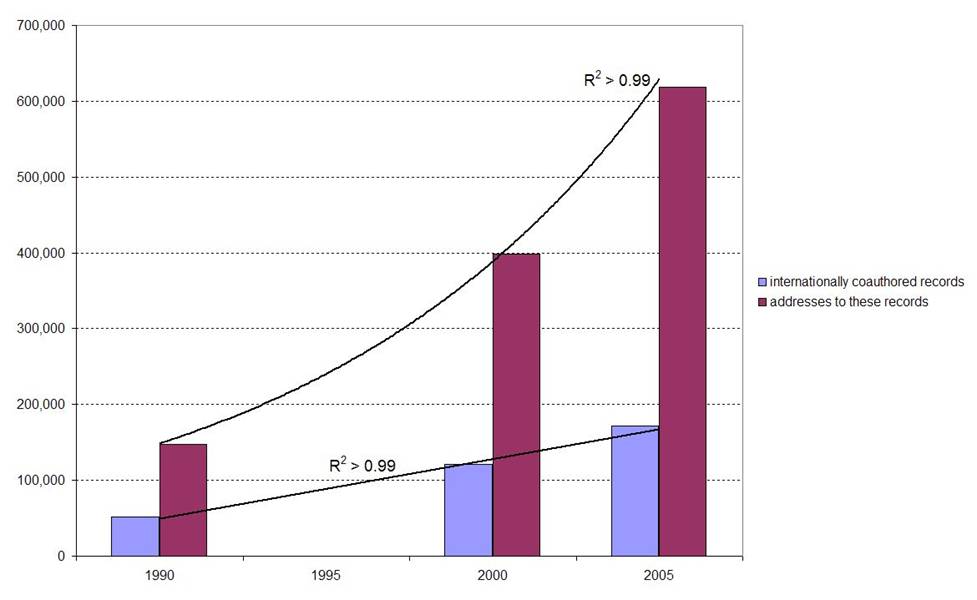
Figure 1. Trends in institutional participation in
global science
In other words, internationally
co-authored publications are increasingly multi-nationally co-authored. Because
the number of records increases only linearly, Persson et al. (2004)
concluded that this trend indicates an inflation in international
collaborations.
Table 2 shows the results of the
social network analysis for the global network of collaborations for the three
years studied. Social network analysis provides us with a large number of
statistics (Newman, 2000). First, the number of nodes in Table 2 represents
the number of countries with authors participating in global science: this
number increased by 20 between 1990 and 2000, with half of this growth due to
the break-up of the Soviet Union into individual states, many of which began to
participate in science as separate political entities during the decade of the
1990s. Between 2000 and 2005, the number of countries in the data set increased
only from 192 to 194.
|
Network statistics
|
1990
|
2000
|
2005
|
|
Number of nodes
|
172
|
192
|
194
|
|
Number of links
|
1,926
|
3,537
|
9,400
|
|
Size k-core component
|
35
|
53
|
64
|
|
Network density
|
0.13
|
0.19
|
0.25
|
|
Average degree
|
22.4
|
36.9
|
48.6
|
|
Average distance
|
2
|
1.9
|
1.8
|
|
Diameter
|
3
|
3
|
3
|
|
Graph betweenness
|
0.26
|
0.16
|
0.14
|
|
Average clustering coefficient
|
0.78
|
0.79
|
0.79
|
Table 2. Social network
analysis of the global science network
The number of links increased
exponentially, as was already noted above. The network of international
collaborations in science expanded more rapidly after 2000. The size of the k-core
component —that
is, the dense network in the center—grew from 35 to 64 countries in this
15-year period.
The network as a whole became denser, which means that on average, countries
participating in international collaboration are supporting an increasing
number of collaborators at the global level. The average degree—a measure of
the spread of influence across the network—was
higher in 2000 and 2005 than in 1990, suggesting that as the network grew,
influence and power were spread more widely among nations at the global level
(Burt, 2001).
The average distance across the
network is the average number of steps it takes to go from a given node in the
network to any other node in the network. Here the number in Table 2 shows
that the number of steps between nodes is lower than two—a very low number in
network terms—and that it decreased over the years examined. This suggests
that the network is becoming more densely connected over time. The distance
from one side of the network to the other is measured as the diameter, which is
the number of steps at the global level, a low number that again confirms the
density of the network. A small diameter in a large network is an indication
of the number of connections that can be identified among the members. It also
suggests the possibility of “small worlds” emerging within the network, due to
the implicit connections possible between actors who are not in the same
cluster.
The final network measure shown in
Table 2 is the average clustering coefficient. Clusters are groups within a
network where redundant connections can be found. This coefficient measures
the likelihood that nodes belong to a cluster. The global level can be
considered as a single component, which means that all nations are connected to
all other nations through some pathway in the network. Clustering occurs when
there are many connections within a sub-set of a large network. For example,
clustering is especially evident at the observed level within the European
Union, where public policy has created incentives for international collaboration.
4. The Effects of
Normalization
Normalization is needed to reveal the structure of the
network. Because of its size alone, the USA dominates the network at the
country level in every respect. Normalization enables us to consider the
patterns of collaboration. When the data are normalized for the size of the
participating countries using the cosine, the k-core measure reveals a latent
structure in the data. It indicates that the central group in the network is
becoming smaller (Figure 2).
Figure 2. Normalized trends in participation in a
core group of highly collaborative countries
In 2005, 14 advanced industrial
nations belonged to the core group, down from 21 nations in 2000 and 22 in
1990. The other nations in the network are linked to this core group, but they
are not bound to them in terms of structural relations. An analogy
could be drawn to a volcano where the base is getting wider, but as it grows,
it pushes the summit at the center higher and steeper.
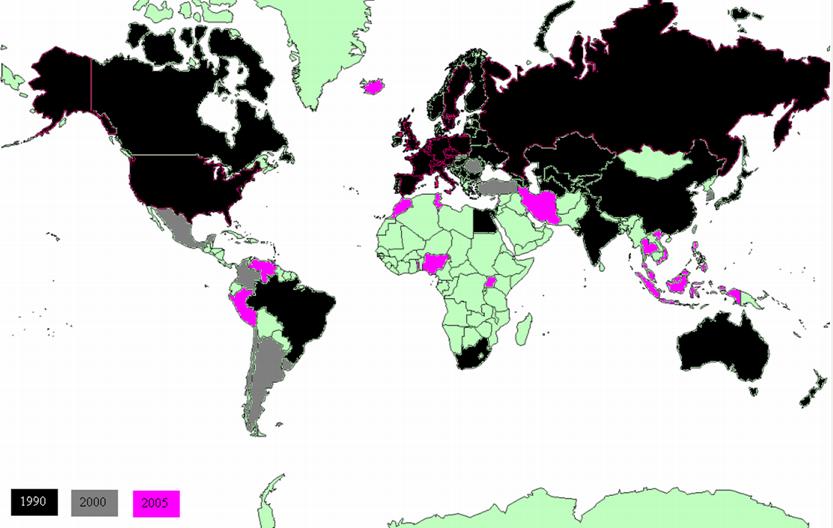
Figure 3. Observed participation in the k-core
group of collaborating countries
Figures 3 and 4 compare membership
in the k-core group of countries for the years studied before and after
normalization. Countries shown in black were member of the core component of
the observed network in 1990. The map shows the countries that joined this
core group in 2000 and in 2005. The observed network is created by the
occurrence of co-authors among scientists from different countries. This
network has grown significantly and shows an increasing number of countries at
the core.
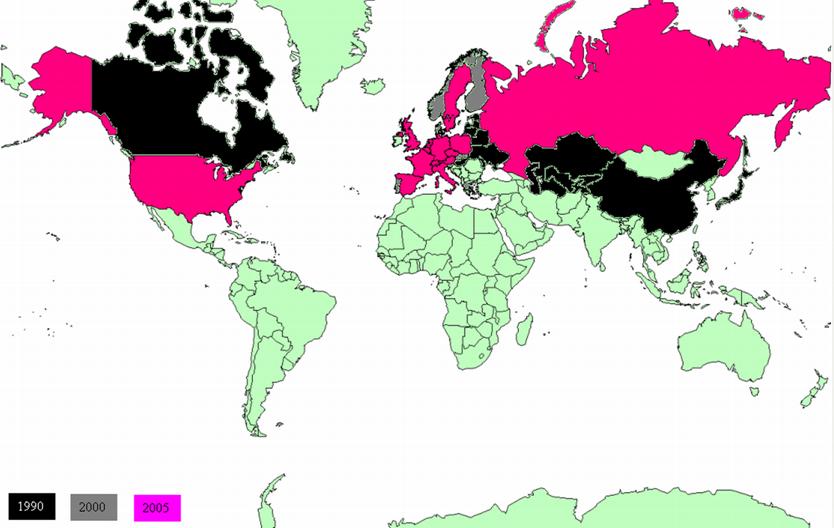
Figure 4. Cosine normalized participation in the k-core
group of collaborating countries
Figure 4 shows this network
normalized for size. In this figure, the core group remains more or less
stable from 1990 to 2000, but shrinks to a smaller set between 2000 and 2005.
This suggests a network dynamic where a core group has evolved into a more
tightly ordered and self-selective group. Note that by 2005 this core group no
longer includes all EU-nations, but the remaining non-EU nations are only the USA, Russia, and Switzerland. This “Scienceland” does not coincide with “Euroland:” Denmark, Finland, and Portugal are no longer included, and Ireland has never been included
(Leydesdorff, 2000).
We explored the network statistics
for the normalized case as were done above (Table 2) for the non-normalized
one. Interestingly, social network analysis provided us with the following
indicator of change in the percentage of betweenness centrality among nations (Freeman,
1977, 1978; Leydesdorff, 2007):
|
1990
|
2000
|
2005
|
|
USA
|
27.8
|
France
|
20.5
|
France
|
31.0
|
|
France
|
25.2
|
USA
|
15.3
|
Russia
|
9.6
|
|
England
|
12.6
|
England
|
14.8
|
UK
|
7.8
|
|
Australia
|
5.0
|
Russia
|
6.1
|
Sudan
|
7.4
|
|
South
Africa
|
4.4
|
Germany
|
5.3
|
Colombia
|
6.4
|
|
Canada
|
4.0
|
Australia
|
4.1
|
Namibia
|
6.2
|
|
Egypt
|
3.8
|
Denmark
|
3.9
|
Germany
|
6.2
|
|
Fed Rep
Ger
|
3.4
|
Canada
|
3.5
|
USA
|
5.9
|
|
Sweden
|
3.1
|
Malaysia
|
3.3
|
Senegal
|
5.7
|
|
Belgium
|
2.9
|
India
|
3.2
|
Cameroon
|
5.0
|
Table
3: Rank
order in the percentage of Betweenness Centrality, cosine ≥ 0.01
As noted, before normalization the USA was in every respect the most central country in all the years studied. After
normalization, however, the USA lost its central position in terms of
betweenness centrality during the 1990s to France. The demise of the Soviet Union
made Russia an increasingly important player at the global level as well. Some
of the developing countries have such a scattered pattern of international
collaborations that they can demonstrate high betweenness centrality in one of
the years for stochastic reasons. Among the major players, however, the
tendencies visible in the 2000 data have been reinforced during the period
2000-2005 (Leydesdorff & Wagner, forthcoming).
5. Discussion
By adding a third year of data to
our earlier analysis (Wagner & Leydesdorff, 2005a), we expected to find
that international collaboration had continued to grow, that the network had
become denser, and that more countries could be counted as part of the core
component of the network. The first and second expectations are satisfied by
the 2005 data: the network has grown larger and denser. The third
expectation—that the core of the network structure has grown—is not supported
after normalization. This finding suggests a different dynamic at work than we
expected.
The core of any network holds a
great deal of power in terms of how the periphery of a network organizes
(Shils, 1998; Burt, 2001). In viewing the core of the network over the 15-year
time period, a divergent outcome can be observed. At the observed level, the
core of the network nearly doubles, suggesting a growing core group of
collaborating countries. When the data are normalized, a smaller and tighter
network is found at the core of the global system. In network terms, this
suggests that the core group is becoming a more coherent cluster, perhaps
reflecting more deliberate choices on the part of collaborators (and
policymakers) to exploit the possibilities offered at the global level. In other
words, as actors began to experience the phenomenon of globalizing links and distributed research during the 1990s, many of them shifted their choices to
incorporate a wider view of the system. But those actors in the
scientifically-advanced countries made more careful choices to limit their partners
to specific countries.
During the 1990s, the “eco-system”
was disturbed by changes in the political system such as the fall of the Soviet
Union and the reunification of Germany. The introduction of the Internet led to
a shift in communications from closed to open (“Mode 2”) systems (Gibbons et
al., 1994). As these events changed the scientific system, the highly
adapted entities (represented by the scientifically advanced countries)
reorganized to take advantage of the changes and protect their positions. The
core of the structural network then began to develop another order at the
global level. Competition and cooperation shifted on the landscape, but this
favored the highly adapted actors. The opportunities for knowledge diffusion
are indeed greatly expanded at the global level, possibly benefiting scientists
at the periphery in terms of having access to the core group. At the same
time, the ability of the core group to access, absorb, and make use of participants
from peripheral countries is made even greater.
In other words, the emergent
pattern of the global system is not created as a result of the actions or plans
of a single entity or actor in the system. The order arises from rules embedded
at the level of the researchers themselves, and self-organizes through
collective action. In evolutionary dynamics, the early phase of the shift that
occurred in the 1990s generated variation, and the actors within the system
responded to stabilize the changes, as retention mechanisms were put into
place. International collaborations have become part of the system that now
includes local, regional, national, and global levels of order.
6. Implications for
Research Policy and Management
Public funding for science has been
supported and managed in the interests of nations for more than a century
(Price, 1963; Ziman 1994). Government investment in and creation of important
technologies spurred economic growth and reinforced a model for postwar science
policy at the national level in the United States and later in Europe and Japan. Large federal agencies grew up to manage the relationships between the political
and scientific communities.
When the scale or scope of research stretched the budgets of the scientifically
advanced nations, joint investments in megascience projects such as the
International Space Station or the Large Hydron Collider resulted in
multi-national projects, but political accountability for investment remained
at the national level (Galison & Hevly, 1992).
The growth of the global network of
science does not mean we are witnessing the death of the nation-state or even a
reduction in its influence in scientific investments. However, it does mean
that nations must take careful stock of the conduct of science at the global
level as well as at the national and regional levels. As the system expands,
useful innovation can increasingly occur somewhere else; identifying
innovations and making them locally available will be a major challenge for
policymakers. Finding ways to evaluate distributed scientific research and
local absorptive capacity is another.
The global system requires new
approaches to public accountability and evaluation. The system as a whole is
likely gaining in efficiency by distributing tasks and sharing resources, as
opposed to creating redundant capacities in different countries. Distributed
tasking of scientific research within highly complementary, competitive, and
self-directed teams can accelerate the testing of ideas and the validation of
scientific concepts. Nevertheless, it may become increasingly difficult to
track spending to outputs and outcomes, which has been the model for much of
public accountability for science in the past.
As scientific capacity continues to
grow around the world, and more links are made among countries, the flow of
knowledge among them may also grow. Nevertheless, if a core group is indeed
developing its own identity and enhancing its absorptive capacity within a
global system, developing countries may find that good ideas will flow from
their laboratories to the larger actors who are better able to publish these
ideas in scientific journals. It may be that the benefits of science can be disseminated
more effectively to the periphery, but this may require deliberate policy
actions on the part of the countries in the center. Managing a complex, open
system requires crafting new incentives to encourage knowledge flows and
participation that favors the peripheral members.
Caroline Wagner gratefully
acknowledges support from the U.S. Department of Energy Office of Basic
Science. The authors wish to thank Susan A. Mohrman for comments on a previous
draft.
Ahlgren, P., Jarneving, B., & Rousseau, R. (2003). Requirement
for a Cocitation Similarity Measure, with Special Reference to Pearson’s
Correlation Coefficient, Journal of the American Society for Information
Science and Technology, 54, 550-560.
Boyack, K. W., Klavans, R., & Börner, K. (2005). Mapping
the Backbone of Science. Scientometrics, 64(3), 351-374.
Braun, T., Glänzel, W., & Schubert, A. (1989). Assessing
Assessments of British Science. Some Facts and Figures to Accept or Decline.
Scientometrics 15, 165-170.
Burt, R. S. (2001). Structural holes versus network closure as social
capital. Social Capital: Theory and Research, eds. N. Lin, K. Cook, & R.
Burt. pp. 31-56. New York: Aldine de Gruyter.
De Nooy, W., Mrvar, A., & Batagelj, V. (2005). Exploratory Social
Network Analysis with Pajek. New York: Cambridge University Press.
Doré, J.-C., Ojasoo, T., & Okubo, Y. (1996). Correspondence
Factorial Analysis of the Publication Patterns of 48 Countries over the Period
1981-1992, Journal of the American Society for Information Science and
Technology, 47, 588-602.
Freeman, L. C. (1977).
A Set of Measures of Centrality Based on Betweenness. Sociometry, 40(1), 35-41.
Freeman, L. C. (1978/1979).
Centrality in Social Networks. Conceptual Clarification. Social Networks, 1,
215-239.
Galison, P., & Hevly, B. (Eds.) (1992). Big Science: The Growth of
Large-Scale Research. Palo Alto: Stanford University Press.
Georghiou, L. 1998. Global Cooperation in Research, Research Policy, 27,
611-626.
Gibbons, M., Limoges, C., Nowotny, H., Schwartzman, S., Scott, P., &
Trow, M. (1994). The new production of knowledge: the dynamics of science and
research in contemporary societies. London: Sage.
Glänzel, W. (2001). National characteristics in international scientific
co-authorship relations, Scientometrics, 51, 69-115.
Hamers, L., Hemeryck, Y., Herweyers, G., Janssen, M., Keters,
H., Rousseau, R., & Vanhoutte, A. (1989). Similarity Measures In
Scientometric Research: The Jaccard Index Versus Salton's Cosine Formula, Information
Processing & Management, 25, 315-318.
Hanneman, R. & Riddle, M. (2006). Introduction to Social Network
Analysis. Available at http://faculty.ucr.edu/~hanneman/.
Last accessed 24 May 2008.
Katz, J.S. & Hicks, D., (1998).
Indicators for Systems of Innovation – a bibliometrics-based approach, IDEA
Paper Series, STEP group.
Leydesdorff, L.
(1989). Words and Co-Words as Indicators of Intellectual Organization. Research
Policy, 18(4), 209-223.
Leydesdorff, L. (2000). Is the European Union Becoming a Single
Publication System? Scientometrics, 47(2), 265-280.
Leydesdorff, L.
(2007a). Should Co-occurrence Data be Normalized? A Rejoinder Journal of the
American Society for Information Science and Technology, 58(14), 2411-2413.
Leydesdorff, L. (2007b). “Betweenness Centrality” as an Indicator of the
“Interdisciplinarity” of Scientific Journals. Journal of the American Society
for Information Science and Technology, 58(9), 1303-1309.
Leydesdorff, L.
(2008). On the Normalization and Visualization of Author Co-Citation Data:
Salton’s Cosine versus the Jaccard Index. Journal of the American
Society for Information Science and Technology, 59(1), 77-85.
Leydesdorff, L., & Vaughan, L. (2006). Co-occurrence Matrices and
their Applications in Information Science: Extending ACA to the Web Environment.
Journal of the American Society for Information Science and Technology, 57(12),
1616-1628.
Leydesdorff, L., & Wagner, C. S. (2009). Is the United States losing ground in science? A global perspective on the world science system.
Scientometrics, 78(1), In press.
Narin, F. (1976). Evaluative Bibliometrics: The Use of Publication and
Citation Analysis in the Evaluation of Scientific Activity, Cherry Hill, NJ: CHI.
Narin, F. (1991). Globalisation of research, scholarly information and
patents—ten year trends. In: Proceedings of the North American Serials Interest
Group NASIF 6th Annual Conference, The Serials Librarian, 21, 2-3.
Newman, M.E.J. (2000). The structure of scientific collaboration
networks. Proceedings of the National Academy of Sciences USA 98, 404-409.
NSB (2002). Science and Engineering Indicators 2002. Washington, DC: National Science Board; available at http://www.nsf.gov/statistics/seind02/
. Last accessed 24 May 2008.
Persson, O., Glänzel, W., & Danell, R. (2004). Inflationary
bibliometrics values: the role of scientific collaboration and the need for
relative indicators in evaluative studies. Scientometrics 60(3), 421-432.
Price, D. J. de Solla (1963). Little Science, Big Science. New York: Columbia University Press.
Salton,
G., & McGill, M. J. (1983). Introduction to Modern Information
Retrieval. Auckland, etc.: McGraw-Hill.
Shils, E. (1988). Center & Periphery: An Idea and Its Career,
1935-1987, In Greenfield, L. & Martin, M. (Eds.), Center: Ideas and
Institutions, pp. 250-282. Chicago: University of Chicago Press.
Wagner, C. S. (2008). The New Invisible College. Washington, DC: Brookings Press.
Wagner,
C.S. & Leydesdorff, L. (2005a). Mapping the network of global science:
comparing international co-authorships from 1990 to 2000. International
Journal of Technology and Globalisation, 1(2), 185-208.
Wagner, C.S. & Leydesdorff, L. (2005b). Network structure,
self-organization, and the growth of international collaboration in science.
Research Policy, 34(10), 1608-1618.
Waltman, L., & van Eck, N. J. (2007). Some comments on the question
whether co-occurrence data should be normalized. Journal of the American
Society for Information Science and Technology 58(11), 1701-1703.
Ziman, J. (1994). Prometheus Bound: Science in a Dynamic Steady State. Cambridge: Cambridge University Press.
return