Introduction
In a lecture entitled “From Computational Linguistics to
Algorithmic Historiography,” Garfield (2001) provided an account of his gradual
invention of “algorithmic historiography” which ultimately led to the program
HistCite™ that was introduced with the paper in JASIST in 2003
coauthored with Pudovkin and Istomin (Garfield et al., 2003a). After the
invention of “bibliographic coupling” by Kessler in 1963 (Kessler, 1963),
Garfield, Sher, & Torpie (1964) developed the concept of the citation as a
recursive operation in a network and used this to map a historical
reconstruction of the development of DNA: from Mendel (1865) to Nirenberg &
Matthaei (1961-1962). These authors claimed (at p. ii) that “The citation
network technique does provide the scholar with a new modus operandi which,
we believe, could and probably will significantly affect future historiography.”
Figure 1: Algorithmic Historiogram of the history of
DNA from Mendel (1865) to Nirenberg & Matthaei (1961-62). Source: Garfield et
al., 1964, at p. 69.
Figure 1 provides the historically first “historiogram” of
1964. The reader will recognize this hand-drawn map as similar to the figures
nowadays generated automatically by HistCite™. In his short history, Garfield noted that thereafter he had put the subject to rest for a period of 36 years.
At the time, the development of the field of computational
linguistics focused on machine translation and natural language processing.
However, the latter problems are technically to be solved at specific moments
in time and are therefore static. Citation analysis was in the meantime
organized in the Science Citation Index on an annual basis, which allows
for comparative statics, but not yet for analyzing the dynamics (Leydesdorff,
1991). Hummon & Doreian’s (1989) paper triggered a renewed interest in the
subject when these authors used citations to analyse main paths in networks
over time. Garfield et al. (2003a) then returned to the topic of the
mapping of the history of DNA using HistCite™, and ever since this program has
become a convenient tool for generating algorithmic historiographies which can
be combined in various ways with other forms of bibliometric analysis (e.g.,
Lucio-Arias & Leydesdorff, 2008).
In the different context of science and technology studies,
Callon et al. (1983) proposed co-word analysis as a means of mapping the
dynamics of science. However, the emphasis in this research tradition has been
more on transversal “translations” than on measuring longitudinal developments
(Callon et al., 1986). Kranakis & Leydesdorff (1989) tried to
combine a historical analysis with co-word analysis of conference papers using
a series of the International Teletraffic Conferences 1955-1983. We concluded
that the scientometric analysis using co-word analysis enables us to show
variations, whereas the intellectual reconstruction by the historian has to
draw a selective line through the history. An evolving complex dynamics then
has to be reduced linguistically by using one geometrical metaphor or another.
The combination of (comparative) statics at each moment of
time with longitudinal analysis—which necessarily selects either on
intellectual grounds (by the historian) or in terms of frequently cited papers
(by the citation analyst)—remained a problem to be solved until relatively
recently. At each moment of time, one can perform multivariate analysis on a
complex dataset (e.g., using cluster of factor analysis). One can then also
compare solutions for different time periods, but this comparison remains
qualitative. For example, it becomes difficult to control the extent to which
the dynamics exhibit the development of error generated by methods which reduce
complexity in the (auto-correlated!) data at different moments of time.
Addressing this problem dynamically assumes solving a system of partial
differential equations in which each variable can change in terms of its value,
but also in relation to the structural dimensions (eigenvectors) of the system
of variables. Usually, one will not be able to solve this problem analytically.
My own solution of the early 1990s was to use entropy
statistics, because in this framework one can use the Shannon (1948) formulas
for the static decomposition of the entropy and the Kullback-Leibler (1951)
divergence for the dynamic analysis of information in one single framework. In
other words, information theory provides us with both a statistics and calculus
(Bar-Hillel, 1955; Leydesdorff, 1995; Theil, 1972). Furthermore, by using
information theory one remains close to the data, that is, without making
parametric assumptions. These methods, however, are computationally intensive (Pearl, 1988) and although exact, sometimes difficult to follow for the social scientist.
Furthermore, at the time there was no development of software comparable to
that available in SPSS or during the 1990s increasingly from the side of social
network analysis.
The problem of combining the static analysis of complexity
at each moment of time with a dynamic analysis was solved only recently as an
extension to multidimensional scaling (Erten et al., 2004; Gansner et
al., 2005). MDS can be used for the visualization, and dynamic MDS can be
extended to the animation (Baur & Schank, 2008). Most techniques for
dynamic visualizations are based on smoothing the transitions by linear
interpolation between static representations in order to optimize the
conservation of a mental map (Moody et al., 2005; De Nooy et al.,
2005; Bender-deMoll & McFarland, 2006). In other words, they are based on
comparative statics. The new algorithm, however, allows for optimizing the
stress both within each year and over consecutive years, that is, by optimizing
the resulting stress in an array of three dimensions or, in other words, a set
of stacked matrices.
This new algorithm was implemented in Visone
(Leydesdorff & Schank, 2008). Visone is a software package for the
visualization of network data (available at http://visone.info;
Baur et al., 2002; Brandes & Wagner, 2004). The special version of Visone
with the dynamic routine added can be web-started from http://www.visone.info/dynamic/jaws/visone.jnlp
or downloaded as stand-alone at http://www.leydesdorff.net/visone/index.htm.
In this study, this program is used for making dynamic co-word maps of the
papers of Eugene Garfield insofar as these have been included in the citation
indices of Thomson Reuters since 1952. I experimented with this technique for a
Festschrift on the occasion of the 65th birthday of Michel
Callon (Leydesdorff, 2010) and then found that the maps and animations became
more informative when in addition to co-words, co-authors and journal names
were used.
Co-words indicate intellectual organization, albeit loosely
(Leydesdorff, 1997); co-authors provide us with social structure, yet without
sufficient information about content (Leydesdorff et al., 2008); and the
names of journals provide convenient anchor points for structural comparison.
As in the previous study, I use cosine-based vector spaces, five-year time
intervals, and only words, authors, and journals that occur more than once in
each specific five-year period. The resulting animation can be retrieved at http://www.leydesdorff.net/garfield/animation.
Methods and materials
Data was collected at the Web of Science on March 15, 2010,
for the full period of 1950-2009, in batches of five-year time periods. (Garfield brings his complete bibliography online at http://www.garfield.library.upenn.edu/pub.html.
This latter data includes keynote addresses and publications not included in
the (Social) Science Citation Index.) Using the citation indexes,
1,546 publications with Garfield as an author were included until December 31,
2009. Of these documents, 1,080 were published in Current Contents
during the period 1973-1993 when the ISI database covered this journal, and 466
were not (Table 1).
|
|
Total
WoS
|
Current
Contents
|
This
study
|
|
1950-1954
|
3
|
0
|
3
|
|
1955-1959
|
5
|
0
|
5
|
|
1960-1964
|
10
|
0
|
10
|
|
1965-1969
|
46
|
0
|
46
|
|
1970-1974
|
237
|
140
|
97
|
|
1975-1979
|
296
|
269
|
27
|
|
1980-1984
|
294
|
268
|
26
|
|
1985-1989
|
358
|
266
|
92
|
|
1990-1994
|
201
|
137
|
64
|
|
1995-1990
|
48
|
0
|
48
|
|
2000-2004
|
37
|
0
|
37
|
|
2005-2009
|
11
|
0
|
11
|
|
Total
|
1546
|
1080
|
466
|
Table 1: Number of papers of Eugene Garfield under
study for each five-year period.
Garfield’s papers provide 85.0% of the total number of
papers published in Current Contents from 1973-1993, when he was also
the editor of this journal. The titles of these papers are sometimes
exceptionally long; for example: “From Information Scientist to Science Critic
– An Introduction to the Role of Information Scientists by Garfield, Eugene,
(Reprinted from The Scientist, Vol 1, Iss 22, Pg 9, 1987) and Science
Needs Critics by Garfield, Eugene, (Reprinted From The Scientist, Vol 1,
Iss 4, Pg 9, 1987),” Current Contents 36, 4 Sep. 1989, 3-7. Because such
a title might completely dominate the co-occurrence maps of title words, we
decided for this reconstruction to use only the 466 other papers published
between 1952 and 2010.
An additional criterion for the selection was that a paper
should contain words or coauthor names which occurred at least twice in a
five-year period. Using this restriction, 305 papers were eventually included
in the exercise. Among the title words of these papers, stop words were removed
using the 429 words listed at http://www.lextek.com/manuals/onix/stopwords1.html.
Thereafter matrices were constructed for each five-year time period with
documents as the units of analysis (the rows) and title words, co-authors, and
journal names as variables (in the columns). In order to anchor the
visualization, “Garfield” as an author was added as a constant to each case.
Among all these variables, cosines can be computed; the threshold for the
visualization was set at cosine ≥ 0.2.
The cosine-normalized matrices were sequenced in a time
series using Pajek
and dedicated software. The resulting dynamic Pajek project file (with the
extension .paj) can be read by Visone, which is then used to generate the
animation (see above). Within the animation authors are indicated as circles in
red, words in green, and journals as diamonds in blue. Stability is set at the
maximum rate of four years. This means that—if available—four periods (of five
years) are taken into account for minimizing the stress. (One can compare this
with a moving average of four periods, but then multivariately and
algorithmically in relation to the stress in the visualization in each period.)
The animation results were textually enriched using BlueBerry Flashback (at http://www.bbsoftware.co.uk/bbflashback.aspx),
a screen-capturing program that allows for editing and the exportation of the
results as an Adobe flash or Windows media file.
Results
Let me discuss the development sequentially in terms of
decades by providing two graphs for each decade.
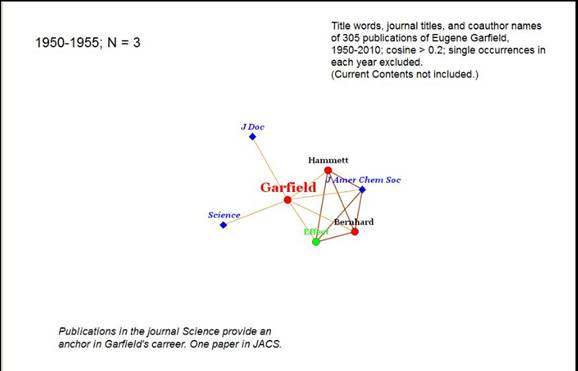
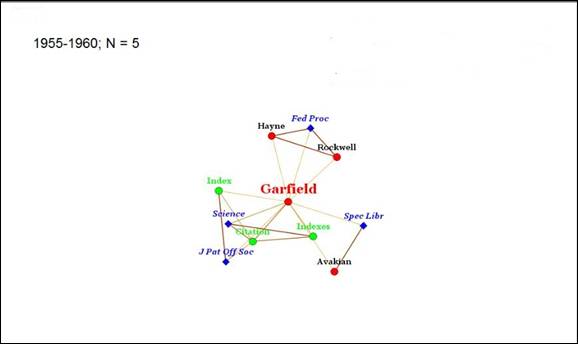
Figure 2: The invention of the citation index during
the 1950s.
In the first half of the 1950s, Garfield (as a junior
scientist) coauthored a publication in the Journal of American Chemical
Society in 1954 (Thackray & Brock, 2000). In this same year, he
published a letter in Science and a paper in the Journal of
Documentation. Probably, the advantages of publishing in Science
then became clear to him, since as we will see, this journal remains a constant
factor during Garfield’s further career (Wouters, 1999, 2000).
The period thereafter (1955-1960) witnesses the birth of the
citation index as an invention. The eventual innovation—that is, its
introduction onto the market—followed much later, with the founding of the ISI
and the subsequent organization of the Science Citation Index (SCI). The
SCI was experimentally published only in 1961. The idea, however, is formulated
in Garfield’s (1955) paper in Science entitled “Citation Indexes for
Science: A New Dimension in Documentation through Association of Ideas” (Science,
122(3159), pp. 108-111, July 1955). In this article, Garfield proposed to
organize scientific citations using the model of Shephard’s Citations,
which has functioned as an index in the legal domain since 1873 (Adair, 1955).
At another place, Garfield (1979a) told the story about the
lobbying and persuading that he had to do in order to get the Science
Citation Index organized (Cronin & Atkins, 2000; Wouters, 1999). The
existing patent system, with its standard routines of attributing references to
patents both by the applicants and the examiners, may have provided another
source of inspiration (Garfield, 1957).
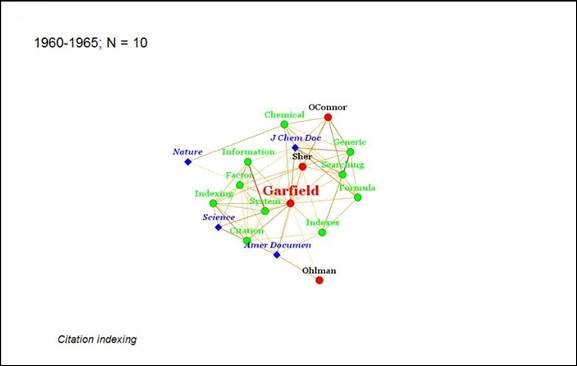
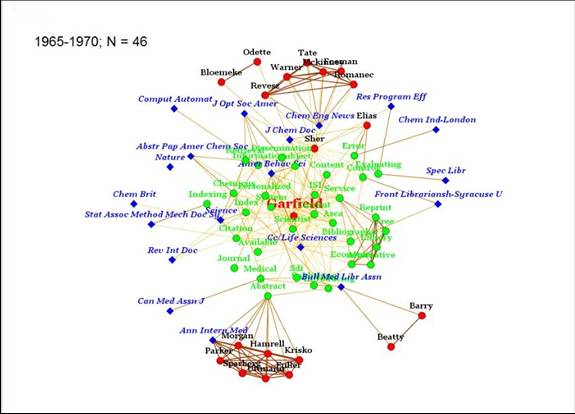
Figure 3: Development during the 1960s. Garfield uses his semantics in different directions in co-authorship relations with other
groups. The pattern of publications in many journals is established in the
second period (1965-1970).
The 1960s, as noted, witnessed the birth of the Science Citation
Index. Derek de Solla Price (1965) enthusiastically tells the story of how
he was invited to play with this encompassing database. which enabled him to
write informed history of science at the macro level. Many new ideas were
developed in this early period (1960-1965), among them Garfield’s already
mentioned 1964 report with Sher in which algorithmic historiography was first
proposed (Garfield et al., 1964). This can be considered as part of a
series of studies with Sher in a research line which had to be abandoned
thereafter in favour of focusing on the development and diffusion of the new
instrument in the period 1965-1975.
In the second period depicted in Figure 3 (1965-1970), one
can see the emergence of new vocabularies relevant for the diffusion of the Science
Citation Index. Garfield still searches co-authorship relations with
authors and groups of authors, but new words and additional journals begin to
prevail in the representation. The groundwork was laid, for example, in an
article in Science in 1964, entitled “Science Citation Index – A
New Dimension in Indexing”: the word was now to be spread!
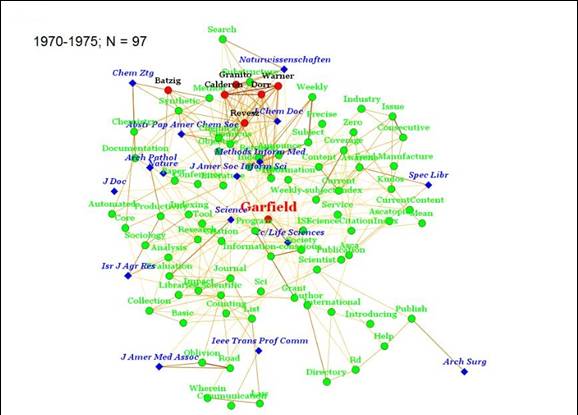
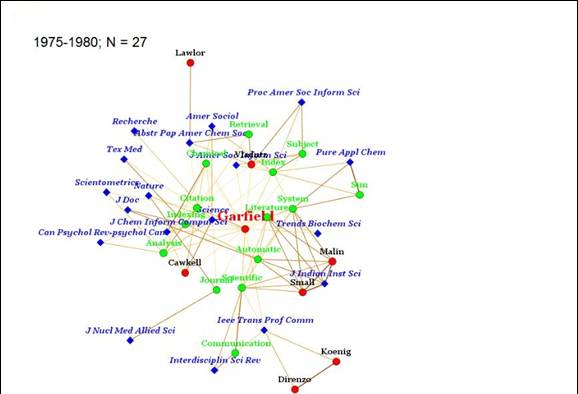
Figure 4: The development of semantics and relations
with new journals in the 1970s.
Figure 4a shows further developments in the period 1970-1975.
A web of words is further shaped without much structure—when compared with the
word structure as visible in the animation of Callon’s oeuvre (available at http://www.leydesdorff.net/callon/animation/index.htm)—but
relating publications in a wide variety of journals. Co-authors have become
more distanced in this vector space. Once established, the relations with
journals tend to become more important than the networks of words in the
periods after 1975. Perhaps, we may conclude that the semantics of the Science
Citation Index were shaped in the period 1965-1975, initially with the help
of co-authors, but increasingly by Garfield himself. The 1972 article in Science
entitled “Citation analysis as a tool in journal evaluation” laid the
foundation for the use of citations for the evaluation of impact (cf. Garfield
& Sher, 1963).
The number of publications is 46 in the period 1965-1970 and
97 during 1970-1975, as against only 26 in the period thereafter (1975-1980).
After 1975 co-authorship relations became rare (for example, with Henry Small
as a continuous factor in Garfield’s environment; e.g., Garfield et al.,
1978), and the words become even more dispersed so that their occurrence disappears
below the thresholds set in this analysis. Relations with journals become
increasingly prominent. In the period 1980-1985, co-authorship relations have
become nearly invisible, and journal names dominate in Figure 5a. Note the
stable relation with the journal Science in the various periods.
Publications in Science functioned as an anchor in Garfield’s oeuvre.
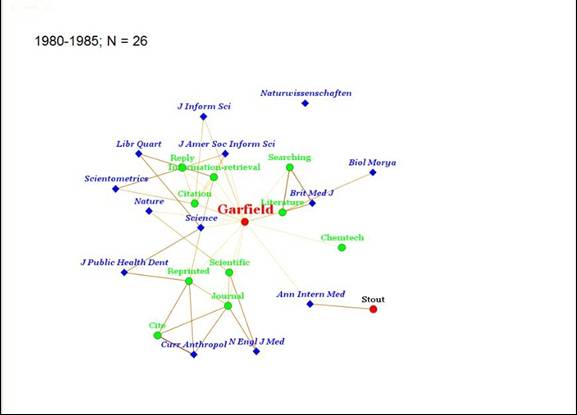
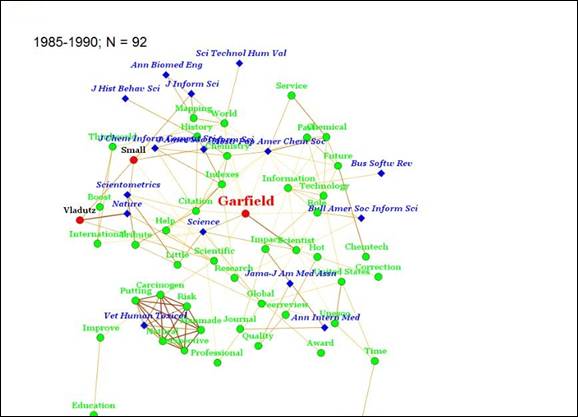
Figure 5: The 1980s: new applications of citation
analysis.
In the latter half of the 1980s, the intellectual program
was renewed with papers in a large number of journals, including many in the
information sciences. In this period, citation indexing is reconsidered no
longer as only a tool for retrieval, but advocated as a research instrument
(e.g., Garfield, 1978, 1979b; Small & Garfield, 1985; cf. Leydesdorff,
1987). New terminology is organized for publications in the newly established
journal of Scientometrics (1978) and in Science, Technology, and
Human Values, which in 1987 became the journal of the Society for the
Social Studies of Science. (Garfield’s Institute of Scientific Information
has supported the yearly Bernal Prizes of this organization.) The turn to the
information sciences, however, prevails in Figure 5b.
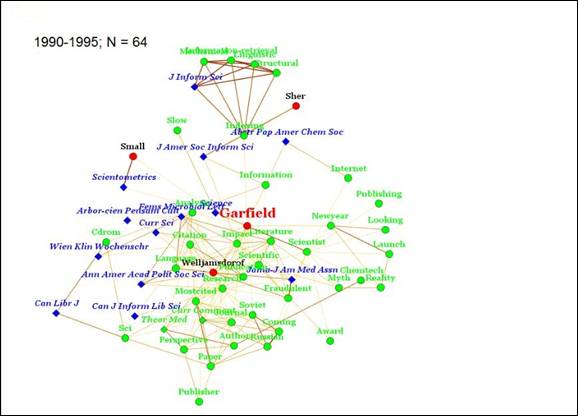
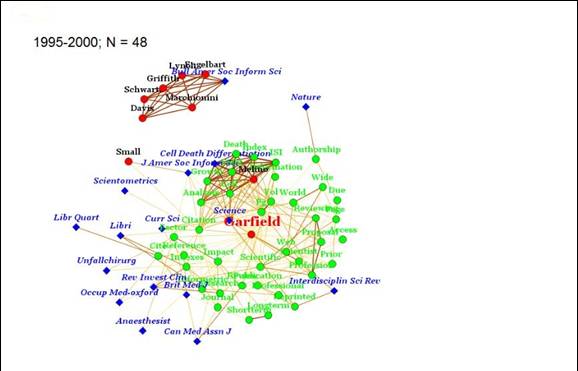
Figure 6: Garfield as an information scientist in the
1990s.
As in previous decades, publications in Science are
central to the development of Garfield’s oeuvre during the 1990s. This journal
seems “close to his heart” in terms of the development of patterns of
collaboration, semantics, and publications. The turn to the information
sciences is now unequivocal. This will eventually be acknowledged by his
election as President of the American Society for Information Science
during the period 1998-2000. During his presidency, Garfield proposed renaming
the society and its journal as American Society for Information Science and
Technology: JASIS accordingly became JASIST in 2001. In the
second half of this period (1995-2000) the network begins to shrink as a result
of his reaching retirement age (Cronin & Atkins, 2000).
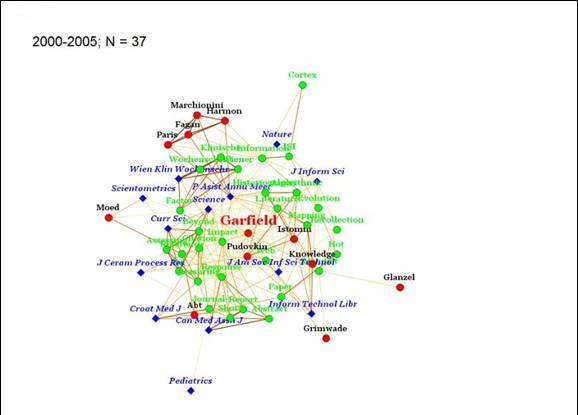
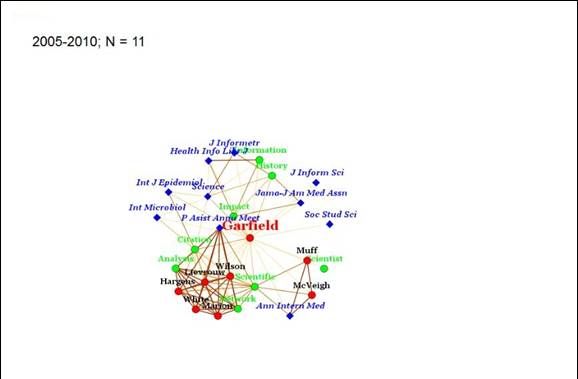
Figure 7: The period 2000-2010: retirement and
renewed interest in algorithmic historiography (2000-2005).
In the first half of the decade 2000-2010, co-authorship
relations re-enter the scene. For example, and of most relevance to our topic,
the program HistCite™ is developed in collaboration with Alexander Pudovkin,
and a series of publications follows. Other relations with leading
scientometricians and information scientists are also visible during this
period. In the final period (2005-2010), the relations with journals—perhaps on
invitation—again seem most prominent. The network now shrinks and the number of
publication decreases to eleven.
Conclusions and discussion
Algorithmic bibliography can enrich the
reconstruction—beyond the drawing of a historiogram showing citation
linkages—with words, co-authorship relations, journal names, or any variable
which can be attributed to a communication as a unit of analysis. Note that
these units of analysis can also be aggregated into oeuvres (or document sets)
which can be compared with one another using these same techniques. Like the
historiography, citation linkages highlight specific lineages across the
document sets (Kranakis & Leydesdorff, 1989). The analysis then presumes a
selective perspective either reflexively, by the qualitative analyst, or
methodologically, by the citation analyst who chooses, for example, to focus on
highly-cited papers.
Other tools have been developed in bibliometrics: citation
analysis was extended to co-citation analysis invented almost simultaneously by
Small (1973) and Marshakova (1973); bibliometric coupling as the reverse
operation preceded this invention (Kessler, 1963); co-word analysis was
developed by Callon et al., (1983), and journal mapping by Leydesdorff
(1986, 1987) and Tijssen et al. (1987), etc. All these structural
properties can be mapped on top of one another as overlays (Leydesdorff et
al., 2008). A consensus has grown in the community that Salton’s cosine can
be used for spanning a vector space in which these vectors can be positioned
(Ahlgren et al., 2003; Egghe & Leydesdorff, 2009; Salton &
McGill, 1983) and then mapped using a spring-embedded algorithm (e.g., Kamada
& Kawai, 1989) or multi-dimensional scaling in one form or another (Van Eck
& Waltman, in print).
In addition to the intellectual lineages shown by
(co-)citation analysis, co-authorship relations may enable the analyst to show
elements of social structures (Burt, 1983; Persson, 2004; Wagner, 2008; Zitt et
al., 2000). Co-word analysis can add substantive content to network
representations and thus facilitate reading. Journal names, for example, add
symbolic value, so that the readers can orient themselves in terms of where to
locate these markers of intellectual organization (Leydesdorff, 1989, 1997). In
Leydesdorff (2010), the static map was stepwise decomposed into co-words,
co-authors, and journal names in order to show how the addition of layers of
heteronegeous networking can add up to the construction of a more informed
representation.
The focus on lineage in citation analysis and historiography
can with hindsight be understood as an attempt to reduce complexity when both
the variables and the structures are subject to change (Leydesdorff, 1997,
2002). Entropy statistics allows us to perform multivariate analysis
dynamically (Leydesdorff, 1991, 1995), but the visualization and a fortiori
the dynamic animation had failed us hitherto for the multivariate case. This
was recently solved using a new algorithm that optimizes the majorant and thus
reduces stress in the multidimensional scaling including the time dimension.
Formulated at a more abstract level, one can thus animate any variable that can
be attributed to texts; for example, one can show the shifting knowledge bases
of (groups of) authors by using the journal names in their cited references and
their bibliographic coupling with BibJourn.Exe (available at http://www.leydesdorff.net/software/bibjourn/index.htm).
Thus, shifts in the knowledge bases of nations can be mapped and animated, in
principle. A new domain of knowledge visualization and animation can thus be
made a subject of research.
In this study, I wished to demonstrate a specific
application of this technique on the occasion of Eugene Garfield’s 85th
birthday, using his own works as recorded in the Science and Social
Science Citation Indexes. The intellectual history thus written is
different from a personal history (Thackray & Brock, 2000) or an institutional
history (Wouters, 1999, 2000) of the same events. Furthermore, we excluded the
hundreds of contributions to Current Contents because the (sometimes
very long) titles of these articles would lead us astray from our purpose of
portraying the intellectual development. I did not focus on citations among the
attributes because one can conveniently obtain the citation graph using
HistCite™. The present analysis adds to a historiogram (e.g., Figure 1) the
multivariate perspective. The dynamic version of Visone was specifically
developed with this purpose in mind (Leydesdorff & Schank, 2008).
Acknowledgement
I am grateful to Katy Börner for her (hitherto informal)
collaboration on this subject.
References:
Adair, W. C.
(1955). Citation indexes for scientific literature. American Documentation,
6, 31–32.
Ahlgren,
P., Jarneving, B., & Rousseau, R. (2003). Requirement for a
Cocitation Similarity Measure, with Special Reference to Pearson’s Correlation
Coefficient. Journal of the American Society for Information Science and
Technology, 54(6), 550-560.
Bar-Hillel, Y.
(1955). An Examination of Information Theory. Philosophy of Science, 22,
86-105.
Baur,
M., Benkert, M., Brandes, U., Cornelsen, S., Gaertler, M., Köpf, B., et al. (2002).
Visone Software for Visual Social Network Analysis. Proc. 9th Intl. Symp. Graph
Drawing (GD ’01). Lecture Notes of Computer Science, 2265, 554-557.
Baur, M., &
Schank, T. (2008). Dynamic Graph Drawing in Visone. Technical University Karlsruhe, Karlsruhe. Available at http://i11www.iti.uni-karlsruhe.de/extra/publications/bs-dgdv-08.pdf.
Bender-deMoll,
S., & McFarland, D. A. (2006). The art and science of dynamic network
visualization. Journal of Social Structure, 7(2), http://www.cmu.edu/joss/content/articles/volume7/deMollMcFarland/.
Brandes, U.,
& Wagner, D. (2004). visone – Analysis and Visualization of Social
Networks. In M. Jünger & P. Mtuzel (Eds.), Graph Drawing Software
(pp. 321-340), Springer.
Burt, R. S.
(1983). Network Data from Archival Records. In R. S. Burt & M. J. Minor
(Eds.), Applied Network Analysis: A methodological introduction (pp.
158-174). Beverly Hills, etc.: Sage.
Callon, M.,
Courtial, J.-P., Turner, W. A., & Bauin, S. (1983). From Translations to
Problematic Networks: An Introduction to Co-word Analysis. Social Science
Information 22, 191-235.
Callon, M., Law,
J., & Rip, A. (Eds.). (1986). Mapping the Dynamics of Science and
Technology. London: Macmillan.
Cronin, B., &
Atkins, H. B. (Eds.). (2000). The Web of Knowledge: A Festschrift in Honor
of Eugene Garfield. Medford, NJ: Information Today.
De
Nooy, W., Mrvar, A., & Batagelj, V. (2005). Exploratory Social
Network Analysis with Pajek. New York: Cambridge University Press.
Egghe, L., &
Leydesdorff, L. (2009). The relation between Pearson’s correlation coefficient r
and Salton’s cosine measure. Journal of the American Society for
Information Science and Technology, 60(5), 1027-1036.
Erten, C.,
Harding, P. J., Kobourov, S. G., Wampler, K., & Yee, G. (2004). GraphAEL:
Graph Animations with Evolving Layouts. Graph Drawing: 11th International
Symposium, GD 2003, Perugia, Italy, September 21-24, 2003. Springer, 2004.
Gansner,
E. R., Koren, Y., & North, S. (2005). Graph Drawing by Stress
Majorization. In J. Pach (Ed.), Graph Drawing, Lecture Notes in Computer
Science (Vol. 3383, pp. 239-250). Berlin/Heidelberg: Springer.
Garfield, E.
(1955). Citation Indexes for Science: A New Dimension in Documentation through
Association of Ideas. Science, 122(3159), 108-111.
Garfield, E.
(1957). Breaking the subject index barrier—a citation index for chemical
patents. Journal of the Patent Office Society, 39(8), 583–595.
Garfield, E.
(1964). Science Citation Index-A new dimension in indexing. Science, 144(3619),
649-654.
Garfield, E.
(1972). Citation Analysis as a Tool in Journal Evaluation. Science 178(Number
4060), 471-479.
Garfield, E.
(1978). Launching the ISI Atlas of Science: For the new year, a new generation
of reviews. Current Contents, 1(January 5), 3-8; Reprinted in Essays of
an Information Scientist, Vol:10, p.11-16, 1987
http://www.garfield.library.upenn.edu/essays/v1910p1001y1987.pdf.
Garfield, E.
(1979a). Citation Indexing: Its Theory and Application in Science,
Technology, and Humanities. New York: John Wiley.
Garfield, E.
(1979b). Is citation analysis a legitimate evaluation tool? Scientometrics,
1(4), 359-375.
Garfield, E.
(2001). From computational linguistics to algorithmic historiography
(Lazerow Lecture). Paper presented at the symposium on “Knowledge and
Language: Building Large-Scale Knowledge Bases for Intelligent Applications,” University of Pittsburg.
Garfield, E.,
Malin, M. V., & Small, H. (1978). Citation data as science indicators. In
Y. Elkana, J. Lederberg, R. K. Merton, A. Thackray & H. Zuckerman (Eds.), Toward
a metric of science: the advent of science indicators (pp. 179-207). New York, etc.: Wiley.
Garfield, E.,
Pudovkin, A. I., & Istomin, V. S. (2003a). Why do we need algorithmic
historiography? Journal of the American Society for Information Science and
Technology, 54(5), 400-412.
Garfield, E.,
Pudovkin, A. I., & Istomin, V. I. (2003b). Mapping the Output of Topical
Searches in the Web of Knowledge and the case of Watson-Crick. Information
Technology and Libraries, 22(4), 183-187.
Garfield, E.,
& Sher, I. H. (1963). New factors in the evaluation of scientific literature
through citation indexing. American Documentation, 14, 195-201.
Hummon, N. P.,
& Dereian, P. (1989). Connectivity in a citation network: The development
of DNA theory. Social Networks, 11(1), 39-63.
Kamada, T., &
Kawai, S. (1989). An algorithm for drawing general undirected graphs. Information
Processing Letters, 31(1), 7-15.
Kessler, M. M.
(1963). Bibliographic coupling between scientific papers. American
Documentation, 14, 10-25.
Kranakis, E.,
& Leydesdorff, L. (1989). Teletraffic Conferences: Studying a Field of
Engineering Science. Scientometrics 15(5/6), 563-591.
Kullback, S.,
& Leibler, R. A. (1951). On Information and Sufficiency. The Annals of
Mathematical Statistics, 22(1), 79-86.
Leydesdorff, L.
(1986). The Development of Frames of References. Scientometrics 9,
103-125.
Leydesdorff, L.
(1987). Various Methods for the Mapping of Science. Scientometrics 11,
291-320.
Leydesdorff, L.
(1989). Words and Co-Words as Indicators of Intellectual Organization. Research
Policy, 18(4), 209-223.
Leydesdorff, L.
(1991). The Static and Dynamic Analysis of Network Data Using Information
Theory. Social Networks, 13, 301-345.
Leydesdorff, L.
(1995). The Challenge of Scientometrics: The development, measurement, and
self-organization of scientific communications. Leiden: DSWO Press, Leiden University; at http://www.universal-publishers.com/book.php?method=ISBN&book=1581126816.
Leydesdorff, L.
(1997). Why Words and Co-Words Cannot Map the Development of the Sciences. Journal
of the American Society for Information Science, 48(5), 418-427.
Leydesdorff, L.
(2002). Dynamic and Evolutionary Updates of Classificatory Schemes in
Scientific Journal Structures. Journal of the American Society for
Information Science and Technology, 53(12), 987-994.
Leydesdorff, L.
(2010). What Can Heterogeneity Add to the Scientometric Map? Steps towards
algorithmic historiography. In M. Akrich, Y. Barthe, F. Muniesa & P. Mustar
(Eds.), Festschrift for Michel Callon’s 65th birthday. Paris: École
Nationale Supérieure des Mines.
Leydesdorff, L.,
& Schank, T. (2008). Dynamic Animations of Journal Maps: Indicators of
Structural Change and Interdisciplinary Developments. Journal of the
American Society for Information Science and Technology, 59(11), 1810-1818.
Leydesdorff,
L., Schank, T., Scharnhorst, A., & De Nooy, W. (2008). Animating the
Development of Social Networks over Time using a Dynamic Extension of
Multidimensional Scaling. El Profesional de la Información, 17(6),
611-626.
Lucio-Arias, D.,
& Leydesdorff, L. (2008). Main-path analysis and path-dependent transitions
in HistCite™-based historiograms. Journal of the American Society for
Information Science and Technology, 59(12), 1948-1962.
Marshakova, I. V. (1973). Bibliographic coupling system based on references. Nauchno-Tekhnicheskaya
Informatsiya Seriya, Ser. 2(SSR 2), 3-8.
Mendel,
G. (1865). Versuche über Plflanzenhybriden. Verhandlungen des
naturforschenden Vereines in Brünn, IV 3-47.
Moody, J., McFarland,
D., & Bender-deMoll, S. (2005). Dynamic Network Visualization. American
Journal of Sociology, 110(4), 1206-1241.
Nirenberg,
M. W., & Matthaei, J. H. (1961). The dependence of cell-free protein
synthesis in E. coli upon naturally occurring or synthetic polyribonucleotides.
Proceedings of the National Academy of Sciences of the United States of America, 47(10), 1588.
Pearl, J. (1988).
Probabilistic Reasoning and Artificial Intelligence: Networks of Plausible
Inference. San Mateo, CA: Morgan Kaufman.
Persson, O.,
Glänzel, W., & Danell, R. (2004). Inflationary bibliometric values: The
role of scientific collaboration and the need for relative indicators in
evaluative studies. Scientometrics, 60(3), 421-432.
Salton, G., &
McGill, M. J. (1983). Introduction to Modern Information Retrieval. Auckland, etc.: McGraw-Hill.
Shannon, C. E.
(1948). A Mathematical Theory of Communication. Bell System Technical
Journal, 27, 379-423 and 623-356.
Small, H. (1973).
Co-citation in the Scientific Literature: A New measure of the Relationship
between Two Documents. Journal of the American Society for Information
Science, 24(4), 265-269.
Small, H., &
Garfield, E. (1985). The geography of science: disciplinary and national
mappings. Journal of information science, 11(4), 147.
Thackray, B.,
& Brock, H. B. (2000). Eugene Garfield: history, scientific information and
chemical endeavour. In B. Cronin & H. B. Atkins (Eds.), The Web of
Knowledge: A Festschrift in Honor of Eugene Garfield (ASIS Monograph
Series, pp. 11–23). Medford, NJ: Information Today.
Theil, H. (1972).
Statistical Decomposition Analysis. Amsterdam/ London: North-Holland.
Tijssen,
R., de Leeuw, J., & van Raan, A. F. J. (1987). Quasi-Correspondence
Analysis on Square Scientometric Transaction Matrices. Scientometrics 11,
347-361.
Van Eck, N. J.,
& Waltman, L. (In print). Software survey: VOSviewer, a computer program
for bibliometric mapping. Scientometrics, DOI: 10.1007/s11192-009-0146-3,
1-16.
Wagner, C. S.
(2008). The New Invisible College. Washington, DC: Brookings Press.
Wouters, P.
(1999). The Citation Culture. Amsterdam: Unpublished Ph.D. Thesis, University of Amsterdam.
Wouters, P.
(2000). Garfield as alchemist. In B. Cronin & H. B. Atkins (Eds.), The
Web of Knowledge: A Festschrift in Honor of Eugene Garfield (ASIS Monograph
Series, pp. 65-72). Medford, NJ: Information Today.
Zitt, M.,
Bassecoulard, E., & Okubo, Y. (2000). Shadows of the past in international
cooperation: Collaboration profiles of the top five producers of science. Scientometrics,
47(3), 627-657.
return