Top-down Decomposition of the Journal Citation Report of
the Social Science Citation Index:
Graph- and factor-analytical approaches
Scientometrics 60 (2) (2004), 159-180
Loet Leydesdorff
Science &
Technology Dynamics,
Kloveniersburgwal 48,
1012 CX
Abstract
The aggregated journal-journal citation matrix of the Journal Citation Report 2001 of the Social Science Citation Index is analyzed as a single domain in terms of both its eigenvectors and the bi-connected components contained in it. The traditional disciplines (e.g., economics, psychology, or political science) can be retrieved using both methods. These main disciplines do interact marginally. The space between them is occupied by a large number of small clusters of journals indicating specialties that gravitate among the major disciplines. These specialties operate in a mode different from that of the disciplines. For example, the impact factors are low on average and the developments remain volatile. Factor analysis enables us to study how the smaller bi-connected components are related to the larger ones. Factor analysis also highlights methodological differences among groups which may be theoretically connected in a single bi-component.
1. Introduction
The Journal Citation Reports (JCR) of the (Social) Science Citation Index provide us with the information necessary to construct a virtual citation matrix of all the journals included in relation to one another. This has long been recognized by scientometricians (e.g., Price, 1965; Narin et al., 1972). For computational reasons, however, the analysis of these large data matrices has hitherto required approximations and/or selections of specific subsets.
Single linkage clustering, for example, allows for clustering large datasets without intensive computation because this algorithm sorts only the relations. The analysis of the matrix can thus be reduced to the analysis of a vector (Small & Sweeney, 1985). If the relations were transitive (quod non; cf. Carpenter & Narin, 1973), a status hierarchy among the journals could be constructed (Doreian & Fararo, 1985). The relational algorithm, however, produces “chains” among otherwise heterogeneous groupings and thus obscures differentiations at the structural level (Burt, 1982; Leydesdorff, 1987).
Structure at the network level is contained in the distribution of the relations as redundancy. These patterns of relations can be analyzed in terms of eigenvectors. The eigenvectors can be considered as a representation of both aggregation and (non-linear) interaction among lower-level vectors. However, the factor-analytic approach is computationally intensive: either the whole matrix has to be taken into memory in a divisive top-down approach based on parametric estimates of the model, or all combinations have to be recalculated bottom-up in each agglomeration for a numerical approximation (Pearl, 1988; Leydesdorff, 1995). Because of these limitations, authors in the tradition of structural analysis have focused on comparing theoretically relevant selections (Tijssen et al., 1987; Leydesdorff & Cozzens, 1993).
Recent developments in social network analysis (e.g., Otte & Rousseau, 2002) and the increasing availability of computer memory enable us increasingly to study large data sets in a top-down approach. In this study, I use the Journal Citation Reports 2001 (JCR) of the Social Science Citation Index (SoSCI), which includes 1682 journals. I will construct the aggregated journal-journal citation matrix for the file and decompose this matrix top-down in terms of its main dimensions and bi-connected components. The multi-variate analysis of the dimensions is based on a factor analysis using SPSS. The analysis of bi-connected components belongs to graph analysis. This technique was originally developed in order to find robust clusters in large data sets (Knaster & Kuratowski, 1921) and was more recently incorporated in software tools for social network analysis (Moody & White, 2003).
A network component is called bi-connected if for every triple of vertices a, v, and w there exists a chain between v and w which does not include the vertex a. In other words, each node in the bi-connected component is linked to at least two other nodes in this cluster. Therefore, the network remains connected after removing any vertex (Mrvar & Batagelj, s.d.). This bi-connectedness stabilizes the cluster against changes in the initial selection when producing the database. Thus, the inclusion or exclusion of journals by ISI would not directly affect the large bi-components contained in the network data. While a bi-connected network component provides us with a robust definition of a cluster, a factor or a principal component can be expected to remain very sensitive to the inclusion or exclusion of variables in the domain from which it is algorithmically extracted.

Figure 1
Two bi-connected network components with an articulation point
Between two bi-connected components of a network, there can be an overlap. A vertex in the overlap is called an articulation point. Vertex a of the network is an articulation point of the network if there exist two other, different vertices v and w so that every chain between the two vertices includes also vertex a. Articulation points belong to more than a single bi-connected component and can therefore be considered as a next-order in the hierarchy. A visualization program of social network analysis like Pajek enables us to study both bi-connected components and articulation points by selecting partitions from the data file.[1]
In a previous study I analyzed the 5,748 journals of the Science Citation Index 2001 in terms of this algorithm (Leydesdorff, 2004). I found 222 bi-connected components when the analysis was limited to journals of which the citation patterns relate with a Pearson correlation coefficient (r) of 0.8 or more. The largest of these graphs could be further decomposed into twenty-one bi-connected components when the threshold was raised to r ≥ 0.9 and thereafter r ≥ 0.95. These clusters are unambiguous in terms of their delineations. Since the articulation points were not mutually related in the case of the Science Citation Index, a next-order network overlay of “general science” journals was not indicated. The clusters remain juxtaposed and can hence be used as discrete and robust categories for the journal classification.[2]
In this study, I follow up on the previous one by studying the corresponding structure for the Social Science Citation Index. For a variety of reasons, one would expect the Social Science Citation Index to be less codified than the Science Citation Index (e.g., Leydesdorff, 2003a), and therefore the results in this case may be more complex and ambiguous. The relatively smaller matrix, however, allows me additionally to construct an SPSS systems file and to factor-analyze the matrix. Thus, I can raise further questions of how the graph-analytical and the factor-analytical approaches inform us about the structure of the matrix under study.
2. Methodology
The aggregated journal-journal citation data of the 1682 journals included in the JCR of the SoSCI 2001 were reorganized into an asymmetrical matrix of journals being cited by other journals (and by themselves). “Citing” can be considered as the running variable reproducing the citation matrix each year, while the archive of previous volumes of each journal is “cited” to a variable extent. I shall thus focus on the “citing” dimension of the matrix. Among the possible citation relations of 16822 (= 2,829,124) only 80,408 (= 2.8%) unique citation relations have a value larger than zero.[3] The matrix is therefore extremely sparse or, in other words, can be expected to contain a lot of structure (redundancy).
The journal-journal citation matrix was constructed from the CD-Rom version of the Journal Citation Report using various DOS-based routines and Ucinet 6 for Windows (Borgatti et al., 2002) to organize the data. This latter program allows for the export of the file in an ASCII format (data definition language or DL) that can conveniently be read into SPSS for the multivariate analysis and into Pajek for social network analysis and the visualization.1 In addition to the raw data matrix, a second matrix with Pearson correlation coefficients was constructed (using Ucinet) and analyzed analogously.[4]
Pajek provides a freeware program which allows for the decomposition of these matrices in terms of the bi-components contained in them and the subsequent extraction and visualization of the graphs. The visualization of the bi-components is based on an algorithm that uses the least square method for the mapping given the condition of conflicting constraints (Kamada & Kawai, 1989). The factor-analysis is pursued using SPSS with Varimax rotation on the basis of the Pearson correlation matrices. Visualizations can be provided by using so-called factor plots among the dimensions distinguished.
In a later part of this study, I shall also construct smaller matrices representing subsets of journals. The subsets are based on the selection of a citation environment of a seed journal so that all journals which contribute to this journal’s citing or cited pattern by one percent or more, are included (Leydesdorff & Cozzens, 1993). This leads to sets (and corresponding matrices) of between ten and one hundred journals which can be analyzed in more detail.
3. Results
3.1 The effects of the choice of thresholds
Seventy-four of the 1682 journals included in 2001 were not processed by ISI in the “citing” dimension. Fifteen more journals of the remaining 1608 journals are processed to such a low degree that these virtually empty variables created problems in some of the further analyses. The remaining 1593 journals form a large and fully connected network. 1399 journals (87.8%) of these journals maintain at least one citation relation to another journal with a value of ten or more.
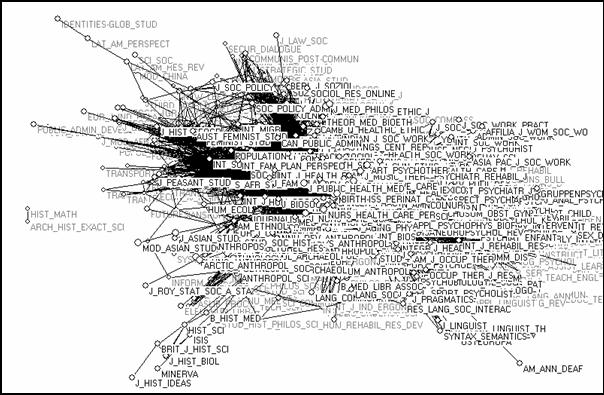
Figure 2
1,399 journals included in the Social Science Citation Index that contain at least ten citation relations with one other journal in the set (Fruchterman & Reingold, 1991; 3D representation).
Figure 2 provides a visualization of this network of 1399 journals.[5] Two journals in the history of mathematics and the exact sciences, respectively, are no longer related to the main network, but only to each other (at this threshold level). Other subgroups are also discernable like the one with a focus on the history of science at the lower-left side of the figure.
Journals which are more central to the social sciences are not visible in this representation because they are more deeply embedded in the network. In two or three dimensions one can observe only the surfaces of this cloud of points. Normalization by using the Pearson correlation as a similarity criterion does not change the overall picture essentially. 1588 journals correlate with an r ≥ 0.2 to any of the other journals. Hardly any journals are isolated in the network of citation relations among journals.
The 1588 journals which correlate with any of the other journal at the level of r ≥ 0.2 form also one big bi-connected component. Thus, one would have to raise this threshold in order to distinguish the various parts of the network which are more densely connected. In the previous study, that is, using the Science Citation Index, I first raised the threshold to r ≥ 0.8. However, when I set the threshold at this relatively high level in this case, I retained only 781 (48.6% of 1608) journals. 587 (36.5%) of these journals could then be organized into 57 bi-connected components. Among these bi-components are the large clusters for major disciplines like economics (87 journals), psychotherapy (61), law (39), and psychology (37). Given the small percentage of journals thus included, however, I decided to pursue another approach and to increment the threshold stepwise beginning at low levels of the Pearson correlation coefficient. Table 1 provides a summary of the results of this stepwise approach.
|
r ≥ |
Nr of journals included |
Nr of bi-connected components |
Nr of articulation points |
Size of bi-component to be further decomposed |
|
0.2 |
1588 |
1 |
0 |
1588 |
|
0.3 |
1576 |
3 |
2 |
1570 |
|
0.4 |
1515 |
3 |
1 |
1506 |
|
0.5 |
1354 |
17 |
7 |
1354 |
|
0.6 |
1058 |
24 |
9 |
923 |
|
0.7 |
727 |
29 |
9 |
247 |
|
0.8 |
188 |
13 |
5 |
(61) |
Table 1
Effects of raising the Pearson correlation coefficient as a threshold
At each round the largest component (rightmost column) is further decomposed after increasing the threshold level of the Pearson correlation with another 0.1 (leftmost column). The number of journals included in the analysis is thus gradually reduced (second column). For example, the bi-component of economics containing 134 journals is one of 29 bi-connected components extractable at the level of r ≥ 0.7. (As will be shown below, each bi-component can further be decomposed by raising the threshold level.) The articulation points between the bi-components are saved as partitions because these interfaces potentially inform us about the relationships between the clusters.
3.2 The Bi-connected Components
Following the above procedure the decomposition could be pursued into 84 bi-connected components. This is about one-third of the number previously found for the Science Citation Index, but this latter database is also more than three times as large in terms of the number of journals included. Furthermore, all bi-components in the SCI related internally at the level of r ≥ 0.8, while only 13 bi-components in this current set (SoSCI) exhibited this degree of internal cohesion. The shape of the distribution of bi-components, however, is similar between the two databases. Figure 3 provides the distribution for the SoSCI.
Figure 3
Size distribution of 84 bi-components contained in the JCR data of the Social Science Citation Index 2001.
The largest bi-component among the journals included in the Social Science Citation Index contains 134 economics journals at the threshold level of r ≥ 0.7. Figure 4 provides a map of this cluster as a whole.
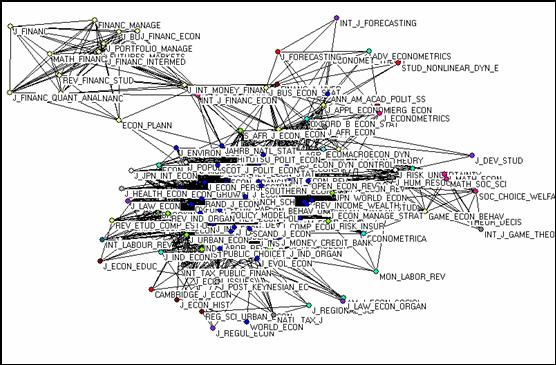
Figure 4
The bi-connected component of 134 economics and related journals at r ≥ 0.7
Although all these journals are bi-connected within a single graph, the figure also shows a relatively separate group of journals focusing on finance and financial management at the left-top side. By raising the threshold to r ≥ 0.75 this latter group can be distinguished and then made visible in more detail (Figure 5). However, a similar separation cannot be achieved by raising the threshold for the econometrics journals discernable at the top right side of Figure 3. These journals are more firmly embedded in the large graph of economics.
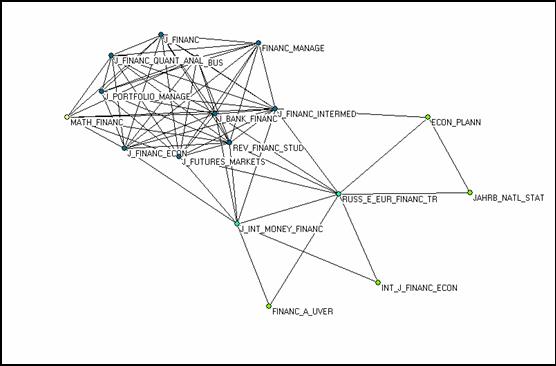
Figure 5
The bi-connected graph of 16 journals focusing on finance and at r ≥ 0.75.[6]
Anticipating a conclusion to be drawn later in this study, this difference in the decomposability of the financial and the econometric subgroup suggests that the graph-analytical (or relational) approach delineates in terms of theoretical topics more than in terms of methodologies. A factor (or positional) analysis will tend to sort econometrics apart from economics because these journals maintain a specific function in the otherwise common field of economics. We shall see below that one can combine the graph-analytical and factor-analytical approaches for studying the theoretical woof and the methodological warp of intellectual organization in the sciences using aggregated citation data among journals (Kuhn, 1962, 1977; Price, 1965; Leydesdorff, 1995).
3.3 The factor-analytic dimensions of the JCR-matrix
As noted, 1608 columns of the matrix contain values different from zero and can therefore be included into the factor analysis of the “citing” patterns of these journals. The initial (principal component) analysis distinguished 342 eigenvectors with a value larger than one. Eigenvalues larger than unity indicate that these eigenvectors explain more than an average variable. This is often used as a cut-off point for the number of factors to be extracted by SPSS. This reduction of the uncertainty, however, would lead in this case to an average cluster size lower than five (1608/342 = 4.7). Thus, the factor analysis confirms the conclusion from the graph analysis (Figure 3 above) that a large number of very small clusters provide a major contribution to the structure of this matrix.
Before discussing these small groupings, let me turn first to the relatively small number of major groups. The distribution underlying the scree-plot shows a cut-off at 18 factors.[7] (This accords with the 16 bi-components with more than twelve journals visible in Figure 3.) I performed the analysis with the full set of 342 extractable factors, these 18 factors, and 12 factors (for reasons of control).
The solution with eighteen factors clearly indicates the major disciplines. Figure 6, for example, shows the plot of the 1608 variables in the plane between the first factor (economics) and the second (psychology).
|
|
|
|
|
|
Figure 6
1608 social science journals plotted in terms of the two main dimensions of the matrix (“economics” and “psychology” journals, respectively).
Only four variables (visible as points in the factor plot of Figure 6) exhibit factorial complexity between these two factors. These are the Journal of Economic Psychology, the Social Science Journal, Social Science Information, and the Tidsskrift for Samfunnsforskning. While along both axes several journals indicate minor factor loadings on the other side, the vast majority of the journals are clearly recognizable on either side or neutral with reference to this classification (and then projected in the neighbourhood of the origin). Negative factor loadings are virtually absent. 179 journals (11.1% of 1608 journals) have a first factor loading on the economics group, and 132 (8.2%) on the psychology group. These large sets include marginal journals which are not included in the bi-connected components representing otherwise approximately the same groupings.
The sharp distinction and thus decomposability among the factors is not specific to only the first two dimensions. The third dimension consists of 122 “psychiatry” journals. This grouping exhibits some correlation with the second (“psychology”) dimension, but Figure 7 shows the relation of this third dimension with the 82 journals with highest factor loadings on the fourth dimension (designated “law”). The interaction between these two major dimensions is marginal again. The absence of negative factor loadings (≤ –0.1) is again noteworthy. In summary, citation patterns among the major journal groupings do not oppose one another nor do they interact at more than a few specific points (journals).
Figure 7
Decomposition of the third and fourth dimension of the citation matrix of 1608 social science journals (“psychiatry” and “law” journals, respectively).
A fifth dimension in this 18-factor solution is again a psychology set (99 journals), but this time with a focus on brain research, cognitive science, and linguistics. The sixth factor provides sociology with 112 journals. The American Sociological Review exhibits the highest factor loading on this dimension. Table 3 summarizes the information for the 18 factors extracted.
|
Factor |
Designation |
Journal with highest factor loading |
Nr of journals with primary loading |
|
1 |
Economics |
Econ J |
179 |
|
2 |
Psychology |
Pers Soc Psychol B |
132 |
|
3 |
Psychiatry |
Compr Psychiat |
122 |
|
4 |
Law |
Georgetwon Law J |
83 |
|
5 |
Cognitive Psychology |
Can J Exp Psychol |
99 |
|
6 |
Sociology |
Am Sociol Rev |
112 |
|
7 |
Developmental Psychology |
Dev Psychol |
82 |
|
8 |
Health Issues |
Public Health |
140 |
|
9 |
Political Science |
Am Polit Sci Rev |
68 |
|
10 |
Clinical Psychology |
J Consult Clin Psychol |
73 |
|
11 |
Organization Studies |
J Organ Behav |
58 |
|
12 |
Marketing and Management |
J Acad Market Sci |
71 |
|
13 |
Geography |
Prog Hum Geog |
67 |
|
14 |
Finance |
J Financ Quant Anal |
23 |
|
15 |
Education |
J Educ Res |
89 |
|
16 |
International Relations |
Rev Int Stud |
72 |
|
17 |
Anthropology |
Annu Rev Anthropol |
84 |
|
18 |
Information Science |
P ASIS Annu Meet |
35 |
|
|
|
|
(1589) |
Table 3
Eighteen main dimensions of the aggregated journal-journal citation matrix from the Social Science Citation Index 2001.
The table shows that psychology is further differentiated into several major fields, and that the above mentioned division between economics/econometrics and financial analysis is also visible in terms of the eigenvectors at the matrix level. In this representation, however, the minor groupings remain by definition subsumed under the disciplinary structures.
The minor groupings can be made visible by increasing the number of factors extracted. As noted, 342 factors can be extracted. However, the cut-off point for the number of factors remains arbitrary. Using other types of multi-variate analysis (e.g., cluster analysis) similar problems about choosing thresholds and levels are unavoidable because the multivariate analysis itself does not indicate an unambiguous cut-off level. The algorithm of bi-connected graphs, however, provides us with a means to delineate robustly between clusters. By using a similarity criterion (in this case, Pearson’s r) for the threshold, one has sufficient ground for distinguishing between the bi-connected components precisely, while in the case of a multi-variate analysis one adds to the similarity criterion an uncertainty introduced by the choice of the clustering algorithm (Leydesdorff & Zaal, 1988; Otte & Rousseau, 2002).
3.4 Fine structure of large clusters
Let us now return to the decomposition of the largest group of economics, econometrics, and financial management journals that provided us above with a bi-connected component of 134 journals, and two factors of 179 and 23 journals, respectively. If we use the Economic Journal—the journal with the highest factor loading on Factor 1—as a seed journal for the generation of a local citation environment by using a threshold of 1% of all citations to this journal both cited and citing (Leydesdorff & Cozzens, 1993), 26 journals are drawn into the analysis. SPSS suggests a four factor solution (on the basis of the criterion of eigenvalues larger than unity). The two main factors can clearly be designated as “economics” and “econometrics” because these eigenvectors are spearheaded by the Journal of Economic Literature (r = 0.88) and Econometrica (r = 0.94),[8] respectively. The factor plot between these first two factors is provided in Figure 8.
Figure 8
Mapping in two main dimensions (“economics” and “econometrics,” respectively) of the citation environment of the Economic Journal (2001)
In summary, the factor analytic approach enabled us first to distinguish between a major dimension “economics/econometrics” (Factor 1) and “finance & financial management” (Factor 14) at the level of the file. Second, a more local decomposition maps the distinction between economics and econometrics as two analytically different research methodologies without separating these dimensions at the level of individual journals. Most of the leading journals exhibit factorial complexity in these two dimensions. The graph-analytical approach, however, kept the financial management journals initially related to the economics and econometrics set, and did not allow us to decompose the latter set into its subsets of econometric and economics journals. In other words, the relational approach of graph analysis enabled us to find the woof of the texture of journal relations in terms of topical relations, while the positional approach highlighted the warp of methodological differentiation within the set.
3.5 Citation environments of articulation points
In addition to the large bi-components representing established disciplines, a large number of small and very small bi-components were found. For example, I found two bi-components at the level of r ≥ 0.8 that were designated on the basis of the titles of the journals included as “addiction research.” Although the second group of twelve journals (bi-component # 81) can with hindsight to the following analysis perhaps also be labeled as “addiction and abuse research,” the substantive difference between these two groups of journals is not obvious to the non-specialist upon inspection of the journal titles. Table 4 provides the listings of journal names for the two bi-components, and Figure 9 provides the graph for the larger of the two.
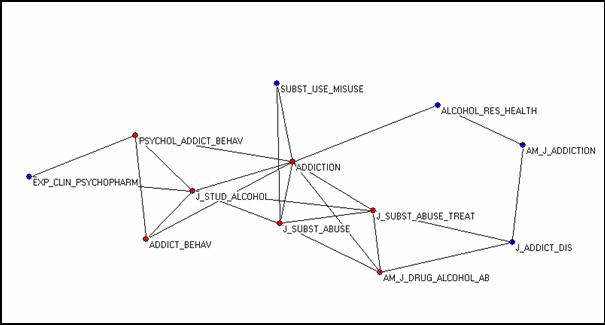
Figure 9
Bi-component # 81 of 12 journals with a focus on “addiction and abuse research.”
|
Bi-component # 80 (4 journals) |
Bi-component # 81 (12 journals) |
|
Addict Res Theory Addiction Drug Alcohol Rev Eur Addict Res
|
Addict Behav Addiction Alcohol Res Health Am J Addiction Am J Drug Alcohol Ab Exp Clin Psychopharm J Addict Dis J Stud Alcohol J Subst Abuse J Subst Abuse Treat Psychol Addict Behav Subst Use Misuse |
Table 4
Listing of two related bi-components in the area of “addiction research.”
As can be seen from Table 4, the two groups share the journal Addiction as an articulation point. This journal is the major journal of the smaller group, but it is also central to the larger one depicted in Figure 9. Using this journal as a seed journal for the generation of a local citation environment 19 journals are drawn into the analysis. Five eigenvectors have a value larger than one. Figure 10 provides the factor plot for the first two dimensions of this environment, clearly indicating the two clusters.
Figure 10
Mapping in two main dimensions of the citation environment of the journal Addiction (2001)
The factor analysis reveals that the articulation point Addiction is firmly embedded in the first (smaller) bi-component # 80. The factor loading of this variable is 0.95, just after Addiction Research and Theory with a factor loading of 0.96. However, Addiction is the single journal with an additional loading (0.22) on Factor 2. The other journals loading on the second factor belong to the other bi-component (# 81).
The specific role of the journal Addiction is not visible in the representation of the bi-component in Figure 9. The journal is similarly central to both bi-components. The larger size of the journal, however, enables it to represent the narrower specialty focusing on the mechanisms of addiction within a larger citation environment that also reports about the consequences of addiction. Addiction has by far the largest impact factor of its group (notably, 2.40).
The smaller journals within the narrow specialty are more exclusively related to one another. Note that other journals (e.g., the Journal of Substance Abuse and the American Journal on Addictions) take an intermediate role in the dimensional vector space of Figure 10 to an extent larger than Addiction, but these journals do not relate the two specialties as an articulation point. The journal Addiction thus ‘articulates’ the small specialty that it represents into the larger citation environment.
3.6 Relations among otherwise unconnected bi-components
In some cases, small bi-connected components seem to relate substantively—as indicated by the journal titles included—but no articulation points between the bi-components can be found. For example, at the level of r ≥ 0.6, two clusters both contain the word “communication” in most of the journal titles (Table 5), but these clusters seem otherwise not related. I distinguished them by designating the one as “mass communication” and the other as “communications research,” but one may wonder whether the relationship between these journal sets can be further indicated by using factor analysis.
|
“Mass communication” Bi-component # 21; 5 journals |
“Communication Research” Bi-component # 22; 3 journals |
|
Eur J Commun Int J Public Opin R J Broadcast Electron Journalism Mass Comm Polit Commun |
Commun Res Hum Commun Res J Commun |
Table 5
Listing of two unrelated bi-components in the area of communication studies
As can be seen from Table 5, there are no articulation points between these two sets. Using Communication Research—the journal with the highest impact factor among these journals—as a seed journal, 15 journals are drawn into the analysis, including the 8 (= 5 + 3) journals of these two bi-components. In a four factor solution, the first dimension is provided by the smaller of the two clusters. The Journal of Communication has the highest factor loading (0.85) on this factor. This cluster includes the journals Western Journal of Communication (0.79) and Health Communication (0.67) in addition to Communication Research (0.81) and Human Communication Research (0.79).
The second grouping, however, is in this case not the other communication studies cluster, but a group of four journals in social psychology. Among these, the highest factor loading is shown by the Journal of Personal and Social Psychology (0.92), followed by Personal and Social Psychology Bulletin (0.92) and the Social Science Computation Review (0.72). These three journals also exhibit factor loading on the first factor, while the fourth journal (American Behavioral Science) loads exclusively on this second factor (0.60).
The “mass communications” group follows as Factor 3, with Political Communication as the journal with the highest factor loading (0.92). The journals in this grouping show variation in their positive and negative correlations with the journal factor loadings on the first two factors. Figure 11 shows the plot of the first versus the third factor. The major journals belonging to the larger “social psychology” cluster do not load strongly on either of these two dimensions, but provide a common frame of reference for these two journal literatures.
Figure 11
Mapping of the first and the third dimension of the citation environment of Communication Research (2001)
If we begin the analysis at the other end, that is, by taking the journal Political Communication as representative—this journal has the highest impact factor (0.64) among this group of journals—we find a similar picture, but now with both a political science and a social psychology factor preceding the two groups of journals in communication studies. These follow only as Factors Four and Five after a third factor of sociological journals (spearheaded by the American Sociological Review). However, the factor plot in Figure 12 is almost identical to that in Figure 11. Thus, this solution is robust: the two groups are different in terms of their citation behaviour. The cluster indicated as “communication research” can be considered as a satellite of social psychology, while the cluster indicated as “mass communication” (or “political communication”) entertains more intensive citation relations also with political science journals. However, the two respective recombinations of disciplinary affiliations are highly specific.
Figure 12
Mapping of the first and the third dimension of the citation environment of Political Communication (2001)
In other words, these small journal groups can be considered as satellites in an interstellar space among the larger disciplines. Although the two clusters relate to one another in terms of their respective origins, neither these disciplinary relationship nor their topical relations can be made visible in terms of bi-connected graphs. The impact factors of these journals are low (<< 1.0), and one needs an analysis in terms of eigenvectors in order to reveal the latent structures of citation patterns in the background.
4. Conclusions
The organization of scientific journal literature in the social sciences falls into two main patterns. First, there are fewer than twenty well-established journal literatures that can be compared with their counterparts in the natural and life sciences. On average these disciplinary groups (e.g., economics and psychology) are even larger than their counterparts, but they are packed less densely. Both factor-analytical and graph-analytical techniques enabled us to see also finer-grained structures within these large sets. Several sub-disciplines of psychology (e.g., social psychology, cognitive science) can each be considered as such a major grouping.
These main dimensions of the database stand orthogonally to one another. The overlap is thin (with the exception of the internal differentiation within the field of psychology). Each of the dimensions contains a core set that can be made visible graph-analytically as a large bi-connected component. These strong cluster structures firmly stabilize the fields against variations. The bi-connected components can be used for the classification of core sets in these (sub)disciplines.
The correlations between the members of each disciplinary set differ more widely than in the natural and life science, and can therefore be considered as field specific. One factor which adds to the uncertainty in the social sciences, for example, is methodology. Unlike the natural and life sciences, the social sciences often construct their subject matter both in terms of “what” they study and in terms of “how” the subject under study is to be analyzed. While some social scientists accept the methods of the natural sciences, others tend to reject this epistemology and argue, for example, for hermeneutic interpretation and understanding. The dividing lines among practitioners in a single discipline using quantitative or qualitative methods can be as strong as those among researchers from different fields (Leydesdorff, 2001).
The results of this study suggest that graph-analytical approaches tend to highlight the substantive domains, while a factor-analytical approach is needed additionally for understanding the underlying commonalities in patterns of journal citations. The relations among the bi-connected components are indicated by articulation points, but the underlying mechanism are not obvious. The main effect of the additional uncertainty in the social sciences seems to be that at some places among the major disciplinary groupings relatively small groups of journals can maintain a specific identity.
These small groups may not be stable (Leydesdorff, 2003a). For example, in the case of science studies we found a longitudinal decay of a previously stabilized interdiscipline during the first half of the 1990s (Leydesdorff & Van den Besselaar, 1997; Van den Besselaar, 2001). In the case of communication studies we found above that this field is internally partitioned in terms of different relations to the parent disciplines (social psychology and political science). The metaphor of little interstellar systems gravitating in discrete orbits between the major configurations may be helpful for the understanding. The small groups tend to keep their identity instead of merging into larger ones.
Most relatively new developments in the social sciences belong to the latter model. Thus, the social sciences to a larger degree than the natural sciences can be said to operate in two modes (Gibbons et al., 1994). Mode 2-sciences, however, are transient and tend to remain vulnerable because they are globalized at the level of international journal literature without being properly stabilized (Leydesdorff, 2003b).
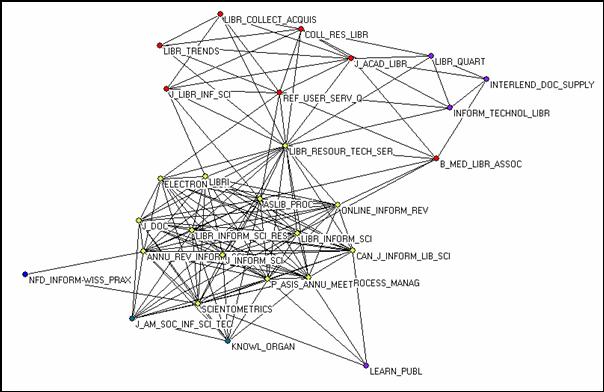
Figure 13
28 journals in the Library and Information Sciences forming a single bi-connected graph in 2001.
The developments in these specialties can develop further momentum, as in “artificial intelligence” (Van den Besselaar & Leydesdorff, 1996; Leydesdorff, 2003a), or be destabilized in a next stage (Leydesdorff & Van den Besselaar, 1997). Because the clusters are small, international recognition of scientists working within these specialities may remain limited and also volatile. Perhaps the information-science community should thus rejoice that this field of studies was stabilized as “library and information science” during the past decades (Leydesdorff, 2002). The relevant set of journals is visible in 2001 both as a factor with 35 journals and as a bi-component of 28 journals (Figure 13). The two composing substructures of library and information science have remained visible in this representation.
References
Ahlgren, P., B. Jarneving, & R. Rousseau (2003). Requirement for a Cocitation Similarity Measure, with Special Reference to Pearson’s Correlation Coefficient. Journal of the American Society for Information Science and Technology, 54(6), 550-560.
Borgatti, S. P., M. G. Everett, & L. C. Freeman (2002). Ucinet for Windows: Software for Social Network Analysis. Harvard: Analytic Technologies.
Burt, R. S. (1982). Toward a Structural Theory of Action. New York, etc.: Academic Press.
Carpenter, M. P., & F. Narin (1973). Clustering of Scientific Journals, Journal of the American Society of Information Science 24, 425-436.
Doreian, P., & T. J. Fararo (1985). Structural Equivalence in a Journal Network. Journal of the American Society of Information Science 36, 28-37.
Fruchterman, T., & E. Reingold (1991). Graph Drawing by Force-Directed Replacement. Software--Practice and Experience 21, 1129-1166.
Gibbons, M., C. Limoges, H. Nowotny, S. Schwartzman, P. Scott, & M. Trow (1994). The New Production of Knowledge: The Dynamics of Science and Research in Contemporary Societies. London: Sage.
Kamada, T., &
S. Kawai (1989). An Algorithm for Drawing General Undirected Graphs. Information Processing Letters, 31(1), 7-15.
Knaster, B. & C. Kuratwoski (1921). Sur les ensembles connexes. Fund. Math. 2, 206-255.
Kuhn, T. S. (1962). The Structure of Scientific Revolutions. Chicago: University of Chicago Press.
Kuhn, T. S. (1977). The Essential Tension: Selected Studies in Scientific Tradition and Change. Chicago: Chicago University Press.
Leydesdorff, L. (1987). Various Methods for the Mapping of Science. Scientometrics 11, 291-320.
Leydesdorff, L.
(1995). The Challenge of Scientometrics: The development, measurement, and
self-organization of scientific communications. Leiden: DSWO / Leiden University; at <http://www.upublish.com/books/leydesdorff-sci.htm>.
Leydesdorff, L. (2001). A Sociological Theory of Communication: The Self-Organization of the Knowledge-Based Society. Parkland, FL: Universal Publishers; at <http://www.upublish.com/books/leydesdorff.htm>.
Leydesdorff, L. (2002). Dynamic and Evolutionary Updates of Classificatory Schemes in Scientific Journal Structures. Journal of the American Society for Information Science and Technology, 53(12), 987-994.
Leydesdorff, L. (2003a). Can Networks of Journal-Journal Citations Be Used as Indicators of Change in the Social Sciences? Journal of Documentation, 59(1), 84-104.
Leydesdorff, L. (2003b). The Construction and Globalization of the Knowledge Base in Inter-Human Communication Systems. Canadian Journal of Communication, 28(3), 1-23.
Leydesdorff, L. (2004). Clusters and Maps of Science Journals Based on Bi-Connected Graphs in the Journal Citation Reports, Journal of Documentation, 60(4), forthcoming.
Leydesdorff, L., & R. Zaal (1988). Co-Words and Citations. Relations between Document Sets and Environments. In: L. Egghe and R. Rousseau (Eds.), Informetrics 87/88 (pp. 105-119). Amsterdam: Elsevier.
Leydesdorff, L., & S. E. Cozzens (1993). The Delineation of Specialties in Terms of Journals Using the Dynamic Journal Set of the Science Citation Index, Scientometrics 26, 133-154.
Leydesdorff, L., & P. v. d. Besselaar (1997). Scientometrics and Communication Theory: Towards Theoretically Informed Indicators. Scientometrics 38, 155-174.
Moody, J. & D. R. White, Structural Cohesion and Embeddedness: A Hierarchical Concept of Social Groups. American Sociological Review 68(1), 103-127.
Mrvar, A., & V. Bagatelj (s.d.). Network Analysis Using Pajek; at http://vlado.fmf.uni-lj.si/pub/networks/pajek/doc/pajekman.htm. Retrieved April 5, 2003.
Narin, F., M. Carpenter, & N. C. Berlt (1972). Interrelationships of Scientific Journals. Journal of the American Society for Information Science 23, 323-331.
Otte, E., & R. Rousseau (2002). Social Network Analysis: A Powerful Strategy, also for the Information Sciences. Journal of Information Science 28(6), 443-455.
Pearl, J. (1988). Probabilistic Reasoning and Artificial Intelligence: Networks of Plausible Inference. San Mateo, CA: Morgan Kaufman.
Price, D. J. de Solla (1965). Networks of Scientific Papers. Science 149, 510- 515.
Small, H., &
E. Sweeney (1985). Clustering the Science Citation Index Using Co-Citations I.
A Comparison of Methods. Scientometrics
7, 391-409.
Tijssen, R., J. de Leeuw, & A. F. J. van Raan (1987). Quasi-Correspondence Analysis on Square Scientometric Transaction Matrices. Scientometrics 11, 347-361.
Van den Besselaar, P. (2001). The Cognitive and the Social Structure of Science & Technology Studies. Scientometrics 51, 441-460.
Van den Besselaar, P., & L. Leydesdorff (1996). Mapping Change in Scientific Specialties: A Scientometric Reconstruction of the Development of Artificial Intelligence. Journal of the American Society for Information Science 47, 415-436.
White, H. D. (2003). Author Cocitation Analysis and Pearson’s r. Journal of the American Society for Information Science and Technology, 54 (13), 1250-1259.
[1] The program Pajek is freely available for non-commercial use at http://vlado.fmf.uni-lj.si/pub/networks/pajek .
[2] The decomposition of the Journal Citation Report 2001 of the Science Citation Index is on-line available at http://www.leydesdorff.net/jcr01 .
[3] Leydesdorff (2003) provides a corresponding figure of 2.7% in 1999. The corresponding figure for the JCR of SCI 2001 was 2.6% (Leydesdorff, 2004).
[4] It would be better to use a non-parametric measure for the normalization (e.g., the cosine), because the Pearson correlation is sensitive to the number of zeros (Ahlgren et al., 2003; White, 2003). However, Ucinet happens to use this similarity measure only.
[5] In this case of a large network, I used the algorithm of Fruchterman & Reingold (1991) for the representation in three dimensions. This algorithm which is also available in Pajek, often provides a richer representation in the case of large sets.
[6] At this threshold level, the Jahrbuch für Nationalökonomie und Statistik provides a single articulation point with the larger set of economics and econometrics journals.
[7] While the difference between the eigenvalue of eigenvector 17 and 18 is still larger than one, the difference between eigenvector 18 and 19 is smaller than 0.1.
[8] The factor loading is by definition equal to the Pearson correlation (r) between the vector and the eigenvector.