Introduction
This study has three objectives:
1. In a
previous communication, Leydesdorff & Opthof (2010a) proposed using
fractional counting of citations as a means to normalize impact factors in
terms of differences in citing behavior (“citation potential”) among
disciplines. We apply this normalization to the 6,598 journals included in the Journal
Citation Reports 2008 (Science Edition) and compare the results with the
ISI Impact Factors.
2. Using the
thirteen fields identified by ipIQ for the purpose of developing the Science
and Engineering Indicators 2010 (NSB, 2010, at p. 5-30 and Appendix Table
5-24), it can be shown that this normalization by fractional counting reduces
the in-between group variance in the impact factors by 81% (when compared with
integer counting) and makes the remaining differences statistically not significant.
3. Because
fractionally counted impact factors can be compared across fields, differences
among the distributions in the numerators (that is, the fractions) can be
tested statistically to determine if they can be used for classification among
fields of science. For example, citation patterns in molecular biology are very
different from citation patterns in mathematics. However, this classification
is unreliable; other sources of variance, such as differences in publication
behavior, cited half-life times, document types, etc., disturb classification
on this basis.
For reasons of presentation, we discuss the third question
before the second one in the results section. Refinements based on the
discussion of field differences can then be tested as an additional model
(Model 4) when answering the second question above.
Let us first turn to the theoretical relevance of these
questions. The well-known impact factor (IF) of the Institute of Scientific
Information (ISI)—presently owned by Thomson Reuters—is defined as the average
number of references to each journal in a current year to “citable items”
published in that journal during the two preceding years. Ever since its
invention in 1965 (Sher & Garfield, 1965; Garfield, 1972 and 1979a), this
ISI-IF has been criticized for a number of seemingly arbitrary decisions
involved in its construction. The possible definitions of “citable items”—articles,
proceedings papers, reviews, and letters—the choice of the mean (despite the well-known
skew in citation distributions; Seglen, 1992), the focus on two preceding years
as representation of impact at the research front (Bensman, 2007), etc., have
all been discussed in the literature, and many possible modifications and improvements
have been suggested (recently, e.g., Althouse et al., 2009).
In response, Thomson Reuters has added the five-year impact
factor (ISI-IF-5), the Eigenfactor Score, and the Article Influence Score (Bergstrom,
2007; Rosvall & Bergstrom, 2008) to the journals in the online version of
the Journal Citation Reports (JCR) in 2007. Most recently,
the JCR 2009 also introduced a new measure of relatedness among journals
(Pudovkin & Garfield, 2002). While the extension of the IF to a five-year
time window is straightforward, the JCR interface at the Web of Science itself
fails to explain the more recently added measures because they can perhaps be
considered as too complex for library usage (Adler et al., 2009, at p.
12; Waltman & Van Eck, 2010a, at p. 1483; cf. West et al., 2008).
Two indicators among the set (e.g., Leydesdorff, 2009; Van
Noorden, 2010) stand out for their intuitive ease of understanding: ISI-IF as
an average number of citations in the current year to publications in the two
preceding years, and the cumulative citations to each journal (“total cites”) as
an indicator of a journal’s overall visibility (Bensman, 2007). “Total cites”
includes the historical record of the journal and therefore can also be
considered as an indicator of prestige—potentially to be defined differently
from a reputation among specialists (Bollen et al., 2006; Brewer et
al., 2001). Science and Nature are the best-known examples of
multidisciplinary journals with high prestige. The influence of a prestigious
journal may reach down all the way into specialties to the level of strategic
interventions, such as the role played by Science in the emergence of
nanotechnology around the year 2000 (Leydesdorff & Schank, 2008).
In other words, the citation networks among journals contain
both a hierarchical stratification and a network structure in which different
densities represent specialties which can be expected to operate in parallel.
The resulting system therefore is complex and not fully decomposable (Simon,
1973). Some journals span the specific distance between two specialties, and
this is often reflected in their titles (e.g., Limnology and Oceanography).
Other journals span larger sets of specialties, such as the Journal of the
American Chemical Society (JACS), which primarily relates organic,
inorganic, and physical chemistry as major subject areas within chemistry, but
also relates to other subdisciplinary structures such as biochemistry and
electrochemistry (Bornmann et al., 2007; Leydesdorff & Bensman,
2006). The Proceedings of the National Academy of Science of the USA (PNAS),
for example, can be compared with Science and Nature for its
transdisciplinary role, but with the JACS for its role in recombining citations
to specialties in the various areas of bio-medicine and molecular biology.
In summary, journals cannot easily be compared, and
classification systems based on citation patterns hence tend to fail. A variety
of perspectives remains possible; in different years, some perspectives may be
more important than others. Indexes such as the ISI Subject Categories
accommodate this multitude of perspectives by listing journals under different
categories for the purpose of information retrieval. Information retrieval,
however, provides an objective different from analytical distinctions (Pudovkin
& Garfield, 2002, at p. 1113n.; Rafols & Leydesdorff, 2009).
Efforts to classify journals using multivariate statistics of
citation matrices have been somewhat successful at the local level
(Leydesdorff, 2006) and more recently also at the global level (Rosvall &
Bergstrom, 2008 and 2010), but the positions of individual journals on the borders
between specialties remain difficult to determine with precision. Thus,
normalization of the ISI-IFs (or other impact indicators) using one
classification of journals or another has hitherto remained an unsolved
problem.
Integer and fractional
counting of citations
Most efforts to classify journals in terms of fields of
science have focused on correlations between citation patterns in core groups
assumed to represent scientific specialties. However, there may be other
statistical patterns which are field specific and allow us to classify
journals. Garfield (1979a and b), for example, proposed the term “citation
potential” for systematic differences among fields of science based on the
average number of references. For example, in the bio-medical fields long
reference lists (for example, with more than 40 references) are common, but in
mathematics short lists (with fewer than six references) are the standard.
These differences are a consequence of differences in citation cultures among
disciplines, but can be expected to lead to significant differences in the ISI-IFs
among fields of science because the chance of being cited is systematically
affected.
We propose to use fractional counting of citations as a means
to normalize for these differences: using fractional counting, a citation in a citing
paper containing n references counts for only (1/n)th of
overall citations instead of a full point (as is the case with integer
counting). The ISI-IF is based on integer counting; this IF is thus sensitive
to differences in citation behavior among fields of science. A fractionally
counted IF would correct for these differences in terms of the sources of the
citations. Such normalization therefore can also be called
“source-normalization” (e.g., Moed, 2010; Van Raan et al., 2010; Waltman
& Van Eck, 2010b; Zitt, 2010).
The suggestion to use fractional counting to solve the
problem of field-specific differences in citation impact indicators originated from
a discussion of measurement issues in institutional research evaluation (Opthof
& Leydesdorff, 2010; Van Raan et al., 2010; Leydesdorff &
Opthof, 2010b). Institutes are populated with scholars with different
disciplinary backgrounds, and research institutes often have among their
missions the objective to integrate bodies of knowledge “interdisciplinarily”
(Wagner et al., 2009; Leydesdorff & Rafols, 2010). In such a case,
one is confronted with the need to normalize across fields of science because
citation practices differ widely across the disciplines and even within them
among specialty areas. Resorting to the ISI Subject Categories for
normalization would beg the question in such cases. Interdisciplinary work may
easily suffer in the evaluation from being misplaced in a categorical
classification system (Laudel & Orrigi, 2006).
The use of fractional counting in citation analysis provides
us with a tool to normalize in terms of the citation behavior of the citing
authors in a current year.
Fractional counting of the citations can be expected to solve the problem of
normalization among different citation practices because each unique citation
is positioned relatively to the citation practice of the author(s) of the citing
document (Bornmann & Daniel, 2008; Leydesdorff & Amsterdamska, 1990).
Otherwise, comparing these uneven units in an evaluation, one might erroneously
conclude that a university could improve its position in the citation ranking
by closing its mathematics department or that a publishing house would be able
to improve the impact of its journals by cutting the set at the lower end of
the distribution of ISI-IFs.
Furthermore, Garfield (2006) noted that larger journals can
be expected to serve larger communities, and therefore there is no a priori
reason to expect them to have higher ISI-IFs. Althouse et al. (2009)
distinguished between two sources of variance: differences between fields are
caused mainly by differences in the ratio of references to journals included in
the JCR set—as opposed to references to so-called “non-source items” (e.g.,
books)—whereas differences in the lengths of reference lists are mainly
responsible for inflation in the ISI-IFs over time.
The application of the tool of fractional counting of
citations to journal evaluation was anticipated by Zitt & Small (2008) and
Moed (2010). Zitt & Small (2008) proposed the Audience Factor (AF) as
another indicator, but used the mean of the fractionally counted
citations to a journal (Zitt, 2010). This mean then was divided by the mean of
all journals included in the SCI. Unlike a mean (or a median, range, or
variance), however, a ratio of two means no longer contains a statistical uncertainty.
The differences between these ratios, therefore, cannot be tested for their significance,
and error in the measurement can no longer be specified.
In a similar vein, Moed (2010) divided a modified IF (with a
window of three years and a somewhat different definition of citable issues) by
the median of the citation potentials in the Scopus database. He
proposed the resulting ratio as the Source Normalized Impact per Paper (SNIP)
which is now in use as an alternative to the IF in the Scopus database
(Leydesdorff & Opthof, 2010a). Note that the IF itself can be considered as
a mean and therefore a proper statistic; the underlying distributions of IFs
can be compared using standard tests (e.g., Kruskal-Wallis or ANOVA; cf.
Bornmann, 2010; Opthof & Leydesdorff, 2010; Plomp, 1992; Pudovkin &
Garfield, in print; Stringer et al., 2010).
In summary, the distributions of citations in the citing
documents can be compared in terms of means, medians, variances, and other
statistics. Differences among document sets can be tested for their significance
independently of whether one uses journals, research groups, or other
aggregating variables for the initial delineation of document sets. Although this
can be done equally for fractional and integer counting, our hypothesis is that
the difference between these two counting methods for citations is caused by the
variation in citation behavior among fields.
Unlike the ISI-IF, one can expect that the distributions resulting
from fractional counting of the citations will be comparable among fields of science.
As a second objective, we will test whether one can use the differences in the
distributions for distinguishing among journal sets in terms of fields of
science. Leydesdorff & Opthof (2010a) developed the proposed method for the
case of the five journals which were used by Moed (2010) for introducing the SNIP
indicator. In this study, we first show that the quasi-IFs based on fractional
counting enable us to distinguish mathematics journals from journals in
molecular biology. However, this test fails at the finer-grained level of
specialties and journals within fields of science. Citation behavior varies
with fields of science, but not among specialties within fields.
Methods and materials
Data processing
Data was harvested from the CD-Rom versions of the SCI
2008 and the JCR 2008. Note that the CD-Rom version of the SCI
covers fewer journals than the Science Citation Index-Expanded (SCI-E)
that is available at the Web of Science (WoS; cf. Testa, 2010). (This core set
is also used for the Science and Engineering Indicators of the National
Science Board of the USA.)
The data on the CD-Rom for 2008 contains 1,030,594 documents published in 3,853
journals.
Of these documents, 944,533 (91.6%) contain 24,865,358 cited references. Each
record in the ISI set contains conveniently also the total number of references
(n) at the document level. Each citation can thus be weighted as 1/n
in accordance with this number in the citing paper.
In a first step, the references to the same journal within a
single citing document were aggregated. For example, if the same document cites
two articles from Nature, the fractional citation count in this case is
2/n. In this step, citations without a full publication year (e.g., “in
press”) were no longer included. This aggregation led to a file with 14,367,745
journal citations; 9,702,753 of these (67.5%) contain abbreviated journal names
that we were able to match with the abbreviated journal names in the list of 6,598
journals included in the SCI-E in 2008.
There was no a priori reason to limit our exercise to
the smaller list of the CD-Rom version of the SCI because all journals
can be cited and IFs for all (6,598) journals in the SCI-E are available
for the comparison. However, one should keep in mind that only citations provided
by the 3,853 journals in the smaller set (of the SCI) are counted
in this study given the database that is used as source data on the citing side.
Thus, one can expect significantly lower numbers of references than those retrievable
at the WoS.
A match in terms of the journal abbreviations in the
reference list was obtained in 6,566 (99.5%) of the 6,598 JCR-journals. These
6,566 journals contain 19,200,966 (77.2%) of the total of 24,865,358 original
references. The citation numbers in this selection are used for computing the total
cites for each journal, both fractionally and as integer numbers. When counted fractionally
the number of references is 555,510.07 (that is, 2.89% of the total number of
references or, in other words, with an average of 34.6 references per citing
article).
SCI 2008
|
Citations to all years
|
Citations to 2006 and
2007
|
|
Nr of cited references
|
24,865,358
|
3,898,851
|
|
Nr of abbreviated
journal titles
|
14,367,745
|
2,936,157
|
|
Nr of abbreviated
journal titles matching
|
9,702,753
|
2,422,430
|
|
Nr of cited references
after matching
|
19,200,966
|
3,320,894
|
|
Nr of cited references
fractionally counted
|
555,510.07
|
596,755.99
(103,828.70)
|
|
Average nr of
references/paper
|
34.6
|
5.6
|
Table 1: Descriptive statistics of the citation data
2008 and the various steps in the processing.
By setting a filter to the citations from 2006 and 2007 in
the original download, the numerators of the weighted quasi-IFs can be
calculated from the same 25M references; the same procedure was repeated for
this subset. The third column of Table 1 shows the corresponding numbers.
The 2008-file contains 3,898,851 references to publications
with 2006 or 2007 as publication years (in 187,966 journals). When counted
fractionally, this number is 124,946.59 citations. 103,828.70 (83.1%) of this
count is included in the analysis using the 6,566 journals for which the
journal abbreviations in the reference lists could be matched with the full journal
names listed in the JCR. However, when divided by the (much smaller) number of cited
references from only the two previous years, the average number of citations
per document is 5.6 and the fractional count adds up across these journals to
595,755.99. We use this latter normalization below because it corresponds, in
our opinion, to the intended focus of the IF on citations at the research front
(that is, the last two years).
For the denominator of our quasi-IFs, we used the sum of the
numbers of citable issues in 2006 and 2007 as provided by the JCRs of these
respective years. By setting a filter to the period 2003-2007, one could analogously
generate a five-year IF, both weighted or without weighting. However, we limit
the discussion here to the two-year IF and follow strictly the definitions of
the ISI (Garfield, 1972). Of the 6,598 journals listed in the JCR-2008 only
5,794 could thus be provided with a value for the denominator of the IF in 2008
based on values for the number of citable items in the two preceding years
larger than zero. In a next step, we use exclusively the references provided to
the 2006 and 2007 volumes of the 5,742 journals which have both a non-zero
value in the numerator (2008) and in both terms of the denominator (2006 and
2007, respectively). These 5,742 journals contain 3,255,133 references or
fractionally counted 583,833.98 references, to publications in 2006 and 2007.
Testing for between-group
variances among fields of science
We will test the extent to which the normalization implied
by using fractional counting reduces the between-group variance in relation to
the within-group variance for the case of the thirteen fields of science identified
by ipIQ for the purpose of developing the Science and Engineering Indicators
2010 (NSB, 2010, at p. 5-30 and Appendix Table 5-24). We chose this
classification because it is reflexively shaped and regularly updated on a
journal by journal basis without automatic processing. Furthermore, journals
are uniquely attributed to a broad field. However, the attribution is made only
for the approximately 3900 journals used as original source data in both this
study and the Science and Engineering Indicators of the NSF.
A two-level regression model will be estimated in which the quasi-IFs
of journals are level-1 units and the 13 fields are level-2 clusters. Various two-level
regression models are possible—depending on the scale of the dependent variable
(here: quasi-IFs). Since IFs for journals are based on citation counts for the
papers published in these journals, citations can be considered as count data. In
the case of count data, a Poisson distribution is the best assumption (Cameron &
Trivedi, 1998). Thus, we shall calculate a two-level random-intercept Poisson
model. In order to handle overdispersion at level 1 (measured as large differences
between the mean and the variance of the IFs) in this model, we follow Rabe-Hesketh
& Skrondal’s (2008) recommendation to use the sandwich estimator for the
standard errors.
Using differences in citation behavior for the
classification
The fractional counts of the citations provide us with
distributions indicating citation behavior at the level of each journal. Which statistics
could be useful to test these multiple citation distributions of different
sizes for the significance of their homogeneity and/or differences?
Let us first note that in the case of integer counting and
aggregated journal citations, one can expect the distributions in homogenous
sets to be highly skewed (Leydesdorff & Bensman, 2006; Seglen, 1992; Stringer
et al., 2010). This expectation is likely to hold also for fractional
counting. Before using parametric statistics for highly skewed
data (e.g., ANOVA) a log-normalising transformation is recommended (Allison,
1980). However, we did not log-normalize the data because our objective
is to test the effects of fractional counting on the field effect in the IF.
This field effect may partly disappear by log-normalizing the data albeit it
less so for the two-year citation window used for the IF (Stringer et al.,
2010). Thus, we would be at risk of confounding two different research
questions.
Post hoc pairwise comparisons can be performed after
obtaining a significant omnibus F with ANOVA. Among the post hoc tests which
are available in SPSS for multiple comparisons, one may prefer to choose one of
the tests which do not ex ante assume equal variance (for example, Dunnett’s
C test). However, this assumption about homogeneity in the variance itself can
first be tested using Levene’s Test for Equality of Variances (available within
ANOVA). If alternatively the assumption holds, one can use the Tukey test
which—as implemented in SPSS—includes controls for testing the significance of
the differences among multiple samples.
A note about differences
with the ISI-IFs
The ISI-IFs are produced by the team at Thomson Reuters
responsible for the JCR. The sum of the total number of times the 6,598
journals included in the Journal Citations Report 2008 (for the SCI)
are cited, is 29,480,301. This is 53.5% more than the total number of citations
(19,200,966) to these journals retrieved above (Table 1). Unlike our download, the
JCR is based on publication years.
Furthermore, Thomson Reuters has hitherto followed a
procedure for generating the JCR that is uncoupled from the production of the
CD-Rom version of the SCI. Like the WoS, the JCR is based on the SCI-E
that includes many more (citing) journals than the CD-Rom version of the SCI.
While the JCR contained 6,598 journals in 2008, the CD-Rom version contained
only 3,853 source journals: these 58.4% of the journals, however, cover 65.1%
of the cited references (cf. Testa, 2010).
The CD-Rom versions are based on processing dates between
January 1 and December 31 while the JCR is based on publication years, but on
the basis of a decision in each year to produce the database at a cut-off date
in March.
In both these databases, the publication years are thus incomplete, and therefore
cannot be expected to correspond to the numbers retrievable from the online
version of the WoS (McVeigh, personal communication, April 7, 2010). Furthermore,
journals may be added to the WoS version which are backtracked to previous
years—and can thus be retrieved online—while both the JCR and the CD-Rom
versions can no longer be changed after their production. Thus, the various
versions of the SCI cannot directly be compared. In the meantime, there
is a blossoming literature complaining about the impossibility of replicating
journal IFs using the WoS (e.g., Brumback, 2008a and b; Rossner et al.,
2007 and 2008; Pringle, 2008).
Results
Let us nevertheless and as a first control compare the ISI-IFs
as provided by the JCR 2008 with the quasi-IFs retrieved from the CD-Rom
version of the SCI 2008. Table 2 provides the Pearson and Spearman rank correlations
between the ISI-IF, the quasi-IF derived from the download of 2008, and the
corresponding quasi-IF based on fractional counting. Not surprisingly—because
of the high value of N—all correlations are significant at the 0.01
level. In the rightmost column, we also added the fractionated
citations/publications ratio for 2008, for reasons to be explained below.
|
|
ISI-IF
|
Quasi-IF (integer)
|
Quasi-IF (fractional)
|
Fractional c/p 2008
|
|
ISI-IF
|
|
.898(**)
|
.835(**)
|
.669(**)
|
|
|
|
5742
|
5742
|
5687
|
|
Quasi-IF (integer)
|
.971(**)
|
|
.937(**)
|
.770(**)
|
|
|
5742
|
|
5742
|
5687
|
|
Quasi-IF (fractional)
|
.926(**)
|
.937(**)
|
|
.813(**)
|
|
|
5742
|
5742
|
|
5687
|
|
Fractional c/p 2008
|
.746(**)
|
.771(**)
|
.818(**)
|
|
|
|
5687
|
5687
|
5687
|
|
**
Correlation is significant at the 0.01 level (2-tailed).
Table
2: Correlations between the ISI-IF, quasi-IFs
based on integer and fractional counting, and fractionally counted citations
divided by publications in 2008.
The lower triangle provides the Pearson correlations (r) and the upper
triangle the corresponding Spearman rank-order correlations (ρ).
Is
field normalization accomplished by fractional counting?
Since it
is not possible to test the 5,742 journals against one another using multiple
comparisons in SPSS, we first focused on the five journals which were discussed
by Moed (2010) and Leydesdorff & Opthof (2010a). (In these previous studies
different criteria were used for reason of comparison with the SNIP indicator
of Scopus.) Table 3 teaches us that the rank-order of the quasi-IFs
among these five journals is different when counted fractionally instead of
using integer counting: Annals of Mathematics in this case has a value
(1.416) higher than that of Molecular Cell (1.143), while the ISI-IF and
the quasi-IF based on integer counting show the expected (large) effect of differences
among the two corresponding fields of science. This provides us with a first
indication that our method for the correction of citation potentials might work.
|
2008
|
ISI-IF2
|
IF (integer)
|
IF (fractional)
|
IF (fractional)*
|
|
1. Invent Math
|
2.287
|
1.294
|
0.595
|
0.064
|
|
2. Mol Cell
|
12.903
|
11.011
|
1.143
|
0.247
|
|
3. J Electron Mater
|
1.283
|
0.868
|
0.255
|
0.043
|
|
4. Math Res Lett
|
0.524
|
0.323
|
0.175
|
0.016
|
|
5. Ann Math
|
3.447
|
2.688
|
1.416
|
0.129
|
Table 3: ISI-IF and quasi IF for integer and
fractional counting.
* The right-most column additionally provides the IF based
on fractional counting, but using all references for the normalization.
We added to Table 3 a right-most column with the values of the IF based on fractional counting, but using the total number of citations
(and not only the ones to publications in 2006 and 2007) for the normalization.
These values are much smaller because of the larger numbers in the respective
denominators of the fractions, and—as perhaps to be expected—they show the
effects of fractional counting to a smaller extent. In other words, the interesting
difference in the rank order is generated by using fractional counting
exclusively on the basis of references to publications in 2006 and 2007. We therefore
use this latter normalization in the remainder of this study.
The Levene test for the homogeneity of variances teaches us
that these five journals are significantly different and that thus a test which
is not based on this assumption should be used. As noted, we use Dunnett’s
C-test in such cases.
|
(I) jnr
|
(J) jnr
|
Mean Difference (I-J)
|
Std. Error
|
95% Confidence Interval
|
|
|
|
Lower Bound
|
Upper Bound
|
Upper Bound
|
Lower Bound
|
|
1
|
2
|
.351876209(*)
|
.024918239
|
.28313736
|
.42061506
|
|
|
3
|
.122373032(*)
|
.029362612
|
.04152074
|
.20322533
|
|
|
4
|
-.054643614
|
.048119007
|
-.18982705
|
.08053982
|
|
|
5
|
-.071077267
|
.033497287
|
-.16341644
|
.02126191
|
|
2
|
1
|
-.351876209(*)
|
.024918239
|
-.42061506
|
-.28313736
|
|
|
3
|
-.229503177(*)
|
.015755897
|
-.27268039
|
-.18632596
|
|
|
4
|
-.406519823(*)
|
.041249535
|
-.52315517
|
-.28988448
|
|
|
5
|
-.422953476(*)
|
.022542261
|
-.48503123
|
-.36087572
|
|
3
|
1
|
-.122373032(*)
|
.029362612
|
-.20322533
|
-.04152074
|
|
|
2
|
.229503177(*)
|
.015755897
|
.18632596
|
.27268039
|
|
|
4
|
-.177016646(*)
|
.044076847
|
-.30117111
|
-.05286219
|
|
|
5
|
-.193450300(*)
|
.027375132
|
-.26872141
|
-.11817919
|
|
4
|
1
|
.054643614
|
.048119007
|
-.08053982
|
.18982705
|
|
|
2
|
.406519823(*)
|
.041249535
|
.28988448
|
.52315517
|
|
|
3
|
.177016646(*)
|
.044076847
|
.05286219
|
.30117111
|
|
|
5
|
-.016433653
|
.046932651
|
-.14835491
|
.11548761
|
|
5
|
1
|
.071077267
|
.033497287
|
-.02126191
|
.16341644
|
|
|
2
|
.422953476(*)
|
.022542261
|
.36087572
|
.48503123
|
|
|
3
|
.193450300(*)
|
.027375132
|
.11817919
|
.26872141
|
|
|
4
|
.016433653
|
.046932651
|
-.11548761
|
.14835491
|
* The mean difference is
significant at the .05 level.
Table 4: Multiple
comparisons among the distributions of the fractional citation counts of the
five journals listed in Table 3; Dunnett’s C-test (SPSS, v15); no homogeneity
in the variance assumed.
Table 4 shows that the fractional citation counts for the
three mathematics journals (numbers one, four, and five) are not
significantly different in terms of this test, while they are significantly
different from the two non-mathematics journals (the numbers two and three)
which additionally are significantly different from each other. Can this test
for homogeneity in this proxy of citation behavior be used for the grouping of
journals more generally?
Testing significant
differences in larger sets
ANOVA post-estimation pairwise comparison (SPSS, v. 15)
allows for testing 50 cases at a time. How to select 50 from among the 5,742 journals
in our domain? Most ISI Subject Categories contain more than 50 journals, but
fortunately, the most problematic one of “multidisciplinary” journals contains
only 42 journals. Preliminary testing of the fractional citation distributions
of this set provided us with both counter-intuitive and intuitively expectable
results. However, we saw no obvious way of validating the quality of the
distinctions suggested by using Dunnett’s C-test within this set.
Thus, we devised another test extending and generalizing
from the above noted difference between the three mathematics journals and the two
other journals. Can journals in mathematics and cellular biology (including Molecular
Cell) be sorted separately using this method? For this purpose we used the
20 journals with highest ISI-IFs in the ISI Category Mathematics
and the 20 journals with highest ISI-IFs in the category of Cell Biology.
In 2008, the top-20 mathematics journals range in terms of
their ISI-IFs from 1.242 for Communications in Partial Differential
Equations to 3.806 for Communications on Pure and Applied Mathematics.
Annals of Mathematics and Inventiones Mathematicae are part of
this set, but Mathematical Research Letters (with an ISI-IF of 0.524) is
not.
Molecular Cell is classified by Thomson Reuters both as
Biochemistry and Molecular Biology
and Cell Biology. The top-20 journals in the latter category range in
terms of their ISI-IF 2008 from 7.791 for the journal Aging Cell to
35.423 for Nature Reviews of Molecular Cell Biology. Thus, one can expect
the two groups (Mathematics and Cell Biology) to be very
different in terms of both their ISI-IFs—there is no overlap in the two ranges—and
their citation practices. Table 5 provides the values for the ISI-IFs and our quasi-IFs—based
on integer and fractional counting, respectively—for the two groups.
Table 5 shows that the mean of the quasi-IFs based on
fractional counting remains more than twice as high for the 20 journals in
molecular biology (1.286) than for the 20 journals in mathematics (0.494).
Thus, the correction for the field level seems not complete. In an email
communication (23 June 2010), Ludo Waltman suggested that the remaining
difference might be caused by the different rates at which papers in the last
two years are cited in these two fields. In the journals classified as Cell
Biology almost all papers contain references to recent (that is in this
context, the last two years) publications, while this is less than half of the
papers in journals classified as Mathematics.
On the basis of this reasoning, a citation window longer
than two years would attenuate this remaining difference. For example, the IF-5
can be expected to do better for this correction than the IF-2. More radically,
the accumulation of all citations—that is, “total cites”—divided by the number
of publications (the c/p ratio) for all years would correct for the differences
among journals in terms of their cited half-lives.
The right-most columns in each category of Table 5, however, show that a
difference between the mathematics set and the cell-biology set remains even when
fractionated c/p ratios—which include citations from all years—are used. Thus,
the field-specific effects are further mitigated, but do not disappear. In
other words, these differences cannot be fully explained by the citation
potentials of the two different fields; the fields remain different. Let us
take a closer look into these differences and to the issue of whether we should
include all or more previous years or only the last two years?
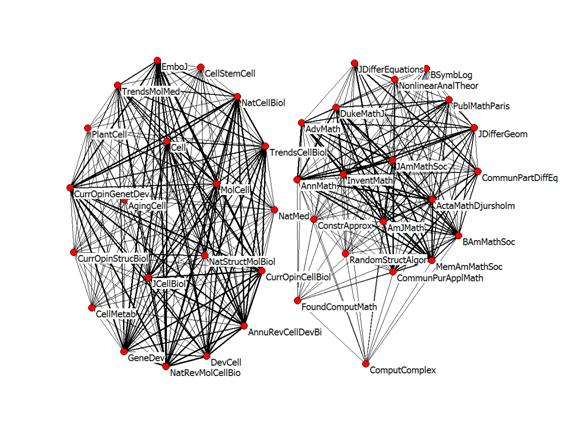
Figure 1: Full citation networks among the two sets
of 20 journals; no thresholds applied; N = 40; layout using Kamada &
Kawai (1989) in Pajek.
Figure 1 shows that there is no citation traffic between
these two groups of journals when 2008 is used as the publication year citing.
Thus, these two groups are fully discrete. (When the map is restricted to
references to 2006 and 2007 only, Computational Complexity is no longer
connected to the mathematics group.) Can this distinction be retrieved by
testing the fractionally counted numerators of the quasi-IFs of the 40 journals
using a relevant post-hoc test?
Among the (2 x 20 =) 40 journals 65,223 references were
exchanged in 2008 to the volumes of 2006 and 2007. Between each two citation
patterns of these 40 journals, one can test the differences for their statistical
significance with ANOVA. Since the variances are again not homogeneous
(Levene’s test), we use the same Dunnett’s C as the post-hoc test on the
(40 * 39)/ 2 = 780 possible pairwise comparisons.
If two journals are not significantly different in terms of
their fractionated citation patterns, they will be considered as belonging to
the same group. Figure 2 shows the results for using these two groups of
journals—with the black and white colors of the nodes indicating the a
priori group assignment to mathematics or cellular biology—using Pajek and
a spring embedded algorithm (Kamada & Kawai, 1989) for the visualization.
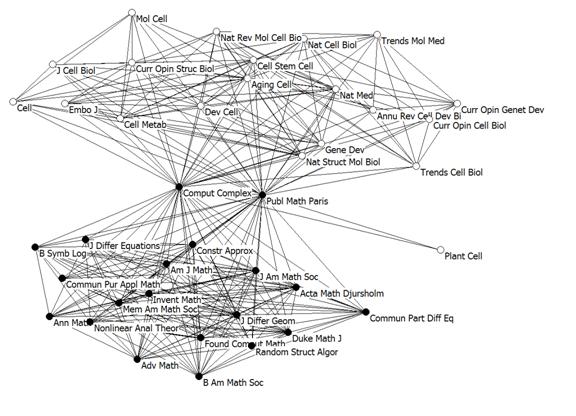
Figure 2. Dunnett’s C test on fractionally counted
citation impacts (2006 and 2007) for two groups of journals.
Journals are linked in the graph (Figure 2) when these
statistics are not significantly different—in other words, the journals
can statistically be considered as a group—in terms of their fractional
citation patterns (being cited in 2008). Although these results are motivating
on visual inspection, they are not completely convincing. The journal Plant
Cell is set apart—as it perhaps should be—but its relationships to the
mathematics journals Computational Complexity and Publications Mathématiques
de l’IHÉS (Paris) are unexpected. The patterns in these latter two journals
deviate from their group (of mathematics journals) and accord also with other
groupings.
One measure of the quality of the classification can be
found in the density of the two networks depicted in Figure 2. Table 6 provides
the densities and average degrees for both the fractionally counted and integer
counted sets and subsets; both for the numerator of the IF and the total cites.
|
|
|
Complete set
N = 40
|
Cell Biology
N = 20
|
Mathematics
N = 20
|
Between
Partitions
|
|
|
|
Density
|
average
degree
|
density
|
average
degree
|
density
|
average
degree
|
Density
|
|
IF
Numerator
|
Fractionally
counted
|
0.41
|
31.6
|
0.53
|
20
|
0.93
|
35.2
|
0.11
|
|
|
Integer
counted
|
0.50
|
39.2
|
0.25
|
7.8
|
0.88
|
33.4
|
0.49
|
|
Total
Cites
|
Fractionally
counted
|
0.28
|
22.0
|
0.14
|
5.4
|
0.57
|
21.6
|
0.22
|
|
Integer
counted
|
0.24
|
18.8
|
0.09
|
3.6
|
0.37
|
14.2
|
0.26
|
Table 6: Densities and average degrees of the top-20
journals in the ISI Subject Categories of Mathematics and Cell
Biology when networked in terms of the significance of the differences in
relevant citation distributions.
In accordance with the results of visual inspection of
Figure 2, one can observe in Table 6 that the density in the subset of
mathematics journals is almost 100% (0.93). On average these journals maintain
35.2 (mutual) relations among the 20 journals. In contrast, however, the density
for the group of 20 journals classified as cell biology is 53%. The citation
patterns of these journals are significantly different from approximately half
of the other journals of this set.
If the same exercise is performed using integer counting, the
effects on the mathematics set are not large (– 5%), but the number of links
within the group of journals a priori classified as cell biology is now
only 25%. Furthermore, the number of links between the two partitions increases
more than four times to 49%. Thus, the number of misclassifications outside the
mathematics group increases significantly using integer counting.
We repeated the same exercise using not only the citations
to the two previous years—that is, the numerators of the IFs—but the total
cites to these 40 journals: 270,595 references are provided in 2008 to papers
in these 40 journals. The larger size of this sample (415%) and the inclusion
of citations to all previous years might make it easier to distinguish the two
sets, but it did not! The two lower rows in Table 6 show that in this case the
density of the relations among the mathematics journals also decreases
considerably, reaching a low of only 37% when integer counting is used.
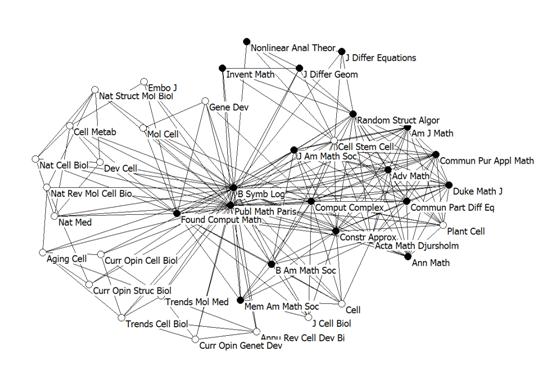
Figure 3: Mapping based on fractional counting of total
cites in 2008; N = 40; Dunnett’s C test; visualization in Pajek using
Kamada & Kawai (1989).
Figure 3 shows the results of mapping the relations that are
not significantly different in terms of their fractionated citation
distributions, but using the full set of total cites (instead of only the
references to 2006 and 2007). Some journals (e.g., Cell Stem Cell—a
relatively new journal—but also Cell) are now misplaced within the
mathematics set.
In summary, the relations at the research front as indicated
by the fractionated IF—that is, using only the last two years—are more
distinctive than the total cites (that is, taking a longer time span into
account). Similarly, a representation based on integer counting in the
numerator of the IF (not shown) confirmed that this methodology can only be
used for this purpose on the fractionally counted numerator of the quasi-IF.
Even then, the classification in terms of the significance of
relations is not reliable. For example, within the group of the 20 mathematics
journals, the fractionated citation pattern of the Journal of Differential
Equations is tested as one of the few significantly different from Communications
in Partial Differential Equations. In any more standard journal mapping
techniques (such as shown in Figure 1), these two journals are visible as
strongly related. In our opinion, this result refutes the idea that this test
on fractionated citation patterns can reliably be used to sort cognitive
differences among journals in terms of fields and specialties.
In summary, the distinction between sets of journals
representing different disciplines and specialties cannot be performed using
the fractional citation characteristics of the distributions. There remains the
question of whether the quasi-IFs based on fractional counting correct
sufficiently in a statistical sense for the different citation potentials among
the broader disciplines. As noted in the methods section above, we used the
thirteen broadly defined fields of the Science & Engineering Indicators (2010)
for this specification using a variance-component model.
Variance-component model
The thirteen fields (NSB, 2010, at p. 5-30 and Appendix
Table 5-24) provide the level-2 clusters, and the (quasi-) IFs of the journals
are the level-1 units for this test. The research question is whether the
differences among fields of sciences (that is, the between-field variance) can
be reduced significantly by the normalization of the numerators of the IFs in
terms of fractional citation counts. For reasons specified above, we defined additionally
a model using the fractional c/p ratios as the dependent variable.
The results of the model estimations are
presented in Table 7. We calculated four models (M1 to M4)—each using a
different method of measuring journal impact: ISI-IFs
2008, quasi-IFs based on integer counting, quasi-IFs based on fractional
counting, and fractionated c/p ratios for 2008. The models assume the intercept
as a fixed effect and the variance of the intercepts across fields as a random
effect. There are 3,923 (M1 to M3) or 3,869 (M4)
IFs of journals, respectively, that are clustered within the 13 fields.
|
|
M1:
ISI-IF 2008
|
M2:
IF (integer counting)
|
M3:
IF (fractional counting)
|
M4:
Fractionated
c/p ratio 2008
|
|
Term
|
Estimate (S.E.)
|
Estimate (S.E.)
|
Estimate (S.E.)
|
Estimate (S.E.)
|
|
Fixed
effect
|
|
|
|
|
|
Intercept
|
.67 (.11)*
|
.02 (.20)
|
-1.28 (.10)*
|
-.75 (.19)*
|
|
Random
effect
|
|
|
|
|
|
Level 2
|
.15 (.06)*
|
.48 (.21)*
|
.09 (.05)
|
.28 (.15)
|
|
Njournal
|
3923
|
3923
|
3923
|
3869
|
|
Nfields
(clusters)
|
13
|
13
|
13
|
13
|
* p < .05
Table 7:
Results of
four two-level random-intercept Poisson models
Our assumption is that the level-2
(between-field) variance is reduced (or near zero) by using the IF based
on fractional counting (M3) or the fractionated c/p ratio
(M4), respectively, compared to the IF based on integer counting (M2). A
reduction of this variance coefficient to close to zero would indicate that systematic
field differences no longer play a role. The model for the ISI-IF (M1) is
additionally included in Table 7; however, only the models M2 to M4 can be
compared directly, because for these models the values for each journal are
calculated on the basis of the same citation impact data.
The results in Table 7 show that the variance component in the
models M1 and M2 are statistically significant. In other words, both sets of
data contain statistically significant differences between the fields. However,
the variance component is not statistically significant in the models M3 and
M4: field differences are no longer significant when the comparison is made in
terms of fractionally counted citations. In the comparison of models M3 and M4
with model M2, the level 2-variance component is reduced by ((.48 –
.09)/.48)*100) = 81% in model M3 and by ((.48 – .28)/.48)*100) = 42% in model M4.
In summary, the largest reduction of the in-between group
variance is associated with model M3; in this case, the in-between group
variance component is close to zero. This result provides a very good validation
of our assumption: field differences in IFs are significantly reduced—to near zero—when
the IFs are based on fractional counting. Using the longer time window as in
the case of the c/p ratios does not improve on this result. In
other words, these results point out that the quasi-IF
based on fractional counting of the citations provides a solution for the
construction of an IF where journals can be compared across broadly defined fields
of science.
Conclusions
Further testing using other sets
(e.g., the multidisciplinary one mentioned above) confirmed our conclusion that
differences in citation potentials cannot be used to distinguish among fields
of science statistically. While citation potentials differ among fields of
science and, therefore, one can normalize the IFs using fractionated citation
counts, this reasoning cannot be reversed. First, other factors obviously play
a role such as the differences among document types (e.g., reviews versus
research articles and conference proceedings) which are also unevenly
distributed among fields of science. Relevant citation windows can also be
expected to vary both among fields and over time. In addition to citation
behavior, publication behavior varies among fields of science. In other words,
the intellectual organization can be expected to affect the textual
organization in ways that are different from the statistical expectations based
on regularities in the observable distributions (Leydesdorff & Bensman, 2006;
Milojević, 2010).
We thought it nevertheless
useful to perform the above exercise. The delineation among fields of
science—and at the next-lower level, specialties—has hitherto remained an
unsolved problem in bibliometrics because these delineations are fuzzy at each
moment of time (e.g., each year) but developing dynamically over time. It would
have been convenient to have a statistical measure to compare journals with each
other on the basis of the citation distributions contained in them at the (citing)
article level. We found that a focus on the last two years—following Garfield’s
(1972) suggestion to follow Martyn & Gilchrist’s (1968) delineation of a
“research front”—worked better than including the complete historical record
(that is, “total cites”). This conclusion accords with Althouse et al.’s
(2009) observation that over time citation inflation affects variation more
than differences among fields.
Our negative conclusion with
respect to the statistical delineation among fields of science does not devalue
the correction to the IFs that can be made by using fractional citation counts
instead of integer ones. One major source of variance could be removed in this
way. In addition to this static variance—in each yearly JCR—the dynamic
variance can be removed by using total citations (that is, the complete
citation window) instead of the window of the last two years. However, this
model did not improve on the regression model using fractional counting for the
last two years. The remaining source of variance perhaps could be found in
different portfolios among disciplines in terms of document types (reviews,
proceedings papers, articles, and letters).
Moed (2010) proposed omitting letters
when developing the SNIP indicator arguing that letters and brief
communications inflate the representation of the research front by using more
references to the last few years. Similarly, one could argue against using
reviews because they may deflate the citation potential based on the most
recent years (Leydesdorff, 2008, at p. 280, Figure 3). Review articles,
however, are currently defined by Thomson Reuters among others as articles that
contain 100 or more references.
One could focus exclusively on articles and proceedings papers, but in this
study we wished to compare the effects of fractionation directly with the
ISI-IF which is based on integer counting of the citations of all “citable
items”.
In other words, differences in
publication behavior—perhaps to be distinguished from citation behavior—can be
expected to provide yet another source of variance (Ulf Sandström, personal
communication, March 5, 2010). Furthermore, the fuzziness of the
delineations may be generated by creative scholars who are able to move and
cite “interdisciplinarily” among fields and specialties (Edge & Mulkay,
1976) and thus provide variation to the intellectual organization of the
textual structures among journals (Lucio-Arias & Leydesdorff, 2009). However,
movements among broadly defined fields of science are exceptional and less likely
to affect the statistics.
Acknowledgement
We are grateful to Tobias Opthof,
Ludo Waltman, and two anonymous referees for communications about previous
drafts.
return
References
Adler, R., Ewing, J., & Taylor, P. (2009). Citation Statistics: A report from the International
Mathematical Union (IMU) in cooperation with the International Council of
Industrial and Applied Mathematics (ICIAM) and the Institute of Mathematical
Statistics (IMS). Statistical Science, 24(1), 1-14.
Allison,
P. D. (1980). Inequality and scientific productivity. Social
Studies of Science, 10(2), 163-179.
Althouse, B. M.,
West, J. D., Bergstrom, C. T., & Bergstrom, T. (2009). Differences in
impact factor across fields and over time. Journal of the American Society
for Information Science and Technology, 60(1), 27-34.
Bensman, S. J.
(2007). Garfield and the impact factor. Annual Review of Information Science
and Technology, 41(1), 93-155.
Bergstrom, C.
(2007). Eigenfactor: Measuring the value and prestige of scholarly journals. College
and Research Libraries News, 68(5), 314.
Bollen,
J., Rodriquez, M. A., & Van de Sompel, H. (2006). Journal status. Scientometrics,
69(3), 669-687.
Bornmann, L.
(2010). Towards an ideal method of measuring research performance: Some
comments to the Opthof and Leydesdorff (2010) paper. Journal of
Informetrics, 4(3), 441-443.
Bornmann,
L., & Daniel, H.-D. (2008). What do citation counts
measure? A review of studies on citing behavior. Journal of Documentation,
64(1), 45-80.
Bornmann, L.,
Leydesdorff, L., & Marx, W. (2007). Citation Environment of Angewandte
Chemie. CHIMIA, 61(3), 104-109.
Brewer, D. J.,
Gates, S. M., & Goldman, C. A. (2001). In Pursuit of Prestige: Strategy
and Competition in U.S. Higher Education. Piscataway, NJ: Transaction
Publishers, Rutgers University.
Brumback, R. A.
(2008a). Response to Correspondence, “Worshiping False Idols: The Impact Factor
Dilemma:” Correcting the Record. Journal of child neurology, 23(9),
1092.
Brumback, R. A.
(2008b). Worshiping false idols: The impact factor dilemma. Journal of child
neurology, 23(4), 365.
Cameron, A. C.,
& Trivedi, P. K. (1998). Regression analysis of count data. Cambridge, UK: Cambridge Univ Press.
Edge, D., &
Mulkay, M. J. (1976). Fallstudien zu wissenschaftlichen
Spezialgebieten (1976). In N. Stehr & R. König (Eds.), Wissenschaftsoziologie,
Topical issue of the Kölner Zeitschrift für Soziologie und Sozialpsychologie
(Vol. 18, pp. 197-230). [Case studies of scientific specialties.
Science Studies Unit, University of Edinburgh, 1974; mimeograph].
Garfield,
E. (1972). Citation Analysis as a Tool in Journal Evaluation. Science
178(Number 4060), 471-479.
Garfield, E.
(1979a). Citation Indexing: Its Theory and Application in Science,
Technology, and Humanities. New York: John Wiley.
Garfield, E.
(1979b). Is citation analysis a legitimate evaluation tool? Scientometrics,
1(4), 359-375.
Garfield, E.
(2006). The History and Meaning of the Journal Impact Factor. JAMA, 295(1),
90-93.
Kamada, T., &
Kawai, S. (1989). An algorithm for drawing general undirected graphs. Information
Processing Letters, 31(1), 7-15.
Laudel, G., &
Origgi, G. (2006). Introduction to a special issue on the assessment of
interdisciplinary research. Research Evaluation, 15(1), 2-4.
Leydesdorff, L.
(2006). Can Scientific Journals be Classified in Terms of Aggregated
Journal-Journal Citation Relations using the Journal Citation Reports? Journal
of the American Society for Information Science & Technology, 57(5),
601-613.
Leydesdorff, L.
(2008). Caveats for the Use of Citation Indicators in Research and
Journal Evaluation. Journal of the American Society for Information Science
and Technology, 59(2), 278-287.
Leydesdorff, L.
(2009). How are New Citation-Based Journal Indicators Adding to the
Bibliometric Toolbox? Journal of the American Society for Information
Science and Technology, 60(7), 1327-1336.
Leydesdorff, L.,
& Amsterdamska, O. (1990). Dimensions of Citation Analysis. Science,
Technology & Human Values, 15(3), 305-335.
Leydesdorff, L.,
& Bensman, S. J. (2006). Classification and Powerlaws: The logarithmic
transformation. Journal of the American Society for Information Science and
Technology, 57(11), 1470-1486.
Leydesdorff, L.,
& Opthof, T. (2010a). Scopus’ Source Normalized Impact per Paper
(SNIP) versus the Journal Impact Factor based on fractional counting of
citations. Journal of the American Society for Information Science and
Technology; in press; DOI: 10.1002/asi.21371.
Leydesdorff, L.,
& Opthof, T. (2010b). Normalization at the field level: fractional counting
of citations. Journal of Informetrics, 4(4), 644-646.
Leydesdorff, L.,
& Opthof, T. (2010c). Scopus’ SNIP Indicator: Reply to Moed. Journal of
the American Society for Information Science and Technology, in press.
Leydesdorff, L.,
& Rafols, I. (2010). Indicators of the Interdisciplinarity of Journals:
Diversity, Centrality, and Citations. Paper presented at the 11th
Conference on Science & Technology Indicators (STI), Leiden, September
8-11.
Leydesdorff, L.,
& Schank, T. (2008). Dynamic Animations of Journal Maps: Indicators of Structural
Change and Interdisciplinary Developments. Journal of the American Society
for Information Science and Technology, 59(11), 1810-1818.
Lucio-Arias, D.,
& Leydesdorff, L. (2009). The Dynamics of Exchanges and References among
Scientific Texts, and the Autopoiesis of Discursive Knowledge. Journal of
Informetrics, 3(2), 261-271.
Martyn, J., &
Gilchrist, A. (1968). An Evaluation of British Scientific Journals. London: Aslib.
Milojević,
S. (2010). Modes of Collaboration in Modern Science: Beyond Power Laws and
Preferential Attachment. Journal of the American Society for Information
Science and Technology, 67(7), 1410-1423.
Moed, H. F.
(2010). Measuring contextual citation impact of scientific journals. Journal
of Informetrics, 4(3), 265-277.
National Science
Board. (2010). Science and Engineering Indicators. Washington DC: National Science Foundation; available at http://www.nsf.gov/statistics/seind10/
(retrieved on July 19, 2010).
Opthof, T., &
Leydesdorff, L. (2010). Caveats for the journal and field normalizations
in the CWTS (“Leiden”) evaluations of research performance. Journal of
Informetrics, 4(3), 423-430.
Plomp, R. (1990).
The significance of the number of highly cited papers as an indicator of
scientific prolificacy. Scientometrics, 19(3), 185-197.
Pringle, J.
(2008). “Worshiping False Idols: The Impact Factor Dilemma”: Correcting the
Record. Journal of child neurology, 23(9), 1092.
Pudovkin, A. I.,
& Garfield, E. (2002). Algorithmic procedure for finding semantically
related journals. Journal of the American Society for Information Science
and Technology, 53(13), 1113-1119.
Pudovkin, A. I.,
& Garfield, E. (in print). Percentile Rank and Author Superiority Indexes
for Evaluating Individual Journal Articles and the Author’s Overall Citation
Performance. CollNet Journal; available at http://garfield.library.upenn.edu/papers/aipegdalianchina2009.pdf
(retrieved on June 18, 2010).
Rabe-Hesketh, S.,
& Skrondal, A. (2008). Multilevel and longitudinal modeling using Stata.
College Station, TX: Stata Press.
Rafols, I., & Leydesdorff, L. (2009). Content-based and Algorithmic Classifications of
Journals: Perspectives on the Dynamics of Scientific Communication and Indexer
Effects Journal of the American Society for Information Science and
Technology, 60(9), 1823-1835.
Rossner, M.,
Epps, H. V., & Hills, E. (2007). Show me the data. Journal of Cell
Biology, 179(6), 1091-1092.
Rossner, M., Van
Epps, H., & Hill, E. (2008). Irreproducible Results—a Response to Thomson
Scientific. The Journal of General Physiology, 131(2), 183-184.
Rosvall, M.,
& Bergstrom, C. T. (2008). Maps of random walks on complex networks reveal
community structure. Proceedings of the National Academy of Sciences, 105(4),
1118-1123.
Rosvall, M.,
& Bergstrom, C. T. (2010). Mapping Change in Large Networks. PLoS ONE, 5(1),
e8694.
Seglen, P. O.
(1992). The Skewness of Science. Journal of the American Society for Information
Science, 43(9), 628-638.
Sher, I. H., & Garfield, E. (1965). New tools for improving and evaluating the effectiveness
of research. Second conference on Research Program Effectiveness, Washinton, DC, July, 27-29.
Simon, H. A.
(1973). The Organization of Complex Systems. In H. H. Pattee (Ed.), Hierarchy
Theory: The Challenge of Complex Systems (pp. 1-27). New York: George
Braziller Inc.
Stringer, M. J.,
Sales-Pardo, M., & Amaral, L. A. N., (2010) Statistical validation of a
global model for the distribution of the ultimate number of citations accrued
by papers published in a scientific journal. Journal of the American Society
for Information Science and Technology, 61(7), 1377-1385.
Testa, J. (2010).
Web of Science Coverage Expansion. Available at http://community.thomsonreuters.com/t5/Citation-Impact-Center/Web-of-Science-Coverage-Expansion/ba-p/10663
(retrieved on July 19, 2010).
Van Noorden, R.
(2010). A profusion of measures. Nature, 465(7300, 17 June 2010), 864-866.
Van
Raan, A. F. J., van Leeuwen, T. N., Visser, M. S., van Eck, N. J., &
Waltman, L. (2010). Rivals for the crown: Reply to Opthof and
Leydesdorff. Journal of Informetrics, 4(3), 431-435.
Wagner, C.,
Roessner, J. D., Bobb, K., Klein, J., Boyack, K., Keyton, J, Rafols, I., Börner, K. (2009 ). Evaluating the Output of Interdisciplinary Scientific Research:
A Review of the Literature. Unpublished report to the National Science
Foundation. Washington, DC: NSF.
Waltman, L.,
& van Eck, N. J. (2010a). The relation between Eigenfactor, audience
factor, and influence weight. Journal of the American Society for
Information Science and Technology, 61(7), 1476-1486.
Waltman,
L., & Van Eck, N. J. (2010b). A general source normalized
approach to bibliometric research performance assessment. Paper presented
at the 11th Conference on Science & Technology Indicators (STI),
Leiden, September 8-11.
West, J.,
Althouse, B., Rosvall, M., Bergstrom, T., & Bergstrom, C. (2008).
Eigenfactor: Detailed methods. Available at http://www.eigenfactor.org/methods.pdf;
retrieved on June 7, 2010, 2008.
Zitt, M. (2010).
Citing-side normalization of journal impact: A robust variant of the Audience
Factor. Journal of Informetrics, 4(3), 392-406.
Zitt, M., &
Small, H. (2008). Modifying the journal impact factor by fractional citation
weighting: The audience factor. Journal of the American Society for
Information Science and Technology, 59(11), 1856-1860.
return