(lesson 9)
Maps for the orientation in Science & Technology areas
Let me point to an easy facility for mapping one's specific field of interest which I made available at http://www.leydesdorff.net/jcr07/cited/index.htm. The list contains all journals contained in the Journal Citation Reports of the ISI (Science and Social Science Citation Index).
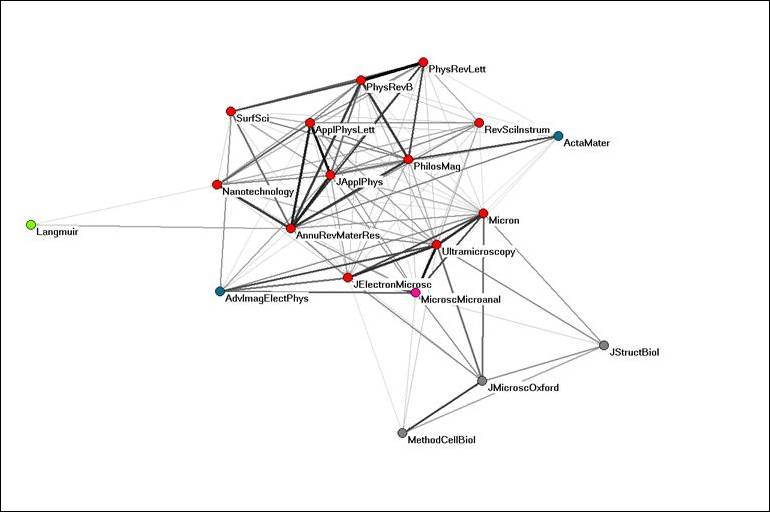
For example, if one is interested in "Ultramicroscopy" scroll the list down (or use Ctrl-F) to the journal of this name. When you click on the file you obtain a text-file in the so-called Pajek input format. Save the file on your harddisk.
The Pajek format is often used for the exchange and can be used by most network visualization programs. Pajek itself is free of charge available at http://vlado.fmf.uni-lj.si/pub/networks/pajek/.
Within Pajek, choose File > Read > Network and read the file that you saved above. When you click Draw, the network is drawn in a circular format. Choose Layout > Energy > Kamada-Kawai > free. The graph opens as below. You may have to adjust some choices under options such as Size > Arrow (set it to zero if you wish no arrows, but lines), etc.
To embellish the picture with colors, you have to invest a bit into Pajek or follow some of the lessons at http://www.leydesdorff.net/indicators . (Lessons 3 and 6 are most relevant.)
For science policy purposes these figures can provide you with a local map of a specific area of interest. The parameters and choices of algorithms are according to the state of the art.