|
Homepage | Publications | Software; data | Courseware; indicators | Animation | Geo | Search website (Google) |
Mapping Patent Data in terms of International Patent Classes (IPC)
Scientometrics (forthcoming); available at http://arxiv.org/abs/1210.6456
Figure 1: Base map for 124 IPC categories at the 3-digit level, using > 39 million US patents (1976-2011); cosine-normalized “citing”; VOSViewer used for the visualization. This map can be accessed interactively from here; the input file is available here.
The mapping of overlays requires the following files to be available in a single folder:
1. uspto1.exe for the initial download at the interface of USPTO (advanced searching at http://patft.uspto.gov/netahtml/PTO/search-adv.htm);
2. ipc.exe for the organization of the databases from the retrieval under 1;
2. ipc.dbf containing the baseline information;
(4. appl_ipc.exe is similar to ipc.exe, but parses and organizes downloads from the database of patent applications at http://appft1.uspto.gov/netahtml/PTO/search-adv.html. Note that patent applications do not contain forward citations.)
All files have to be saved in the same folder (ipc.dbf needs to be present in this folder as well). Files from previous runs may be overwritten; it is advised to empty the folder before downloading and running these routines in order to prevent confusion with previous runs, etc. IPC.exe calls uspto1.exe for the download, but this is optional; one can also use a previously downloaded set.
The routine uspto1.exe accesses the Internet using the MicroSoft Internet protocol in the file MSINet.OCX. If this file was not yet installed when installing another program, an error message may be generated by Windows since the file is not installed with the original installation of Windows. This error can be solved by following the instructions at http://www.leydesdorff.net/software/patentmaps/ocx.htm.
The two routines are integrated into ipc.exe. This routine calls uspto1.exe and uses ipc.dbf. Access to the Internet is required. The user is prompted (by uspto1.exe) for an input string. This search string can be generated and tested at http://patft.uspto.gov/netahtml/PTO/search-adv.htm. One needs a search string which results in more than fifty patents.
For example, the search string “ttl/nano and isd/2010$$” provides 171 patents. The resulting screen looks as follows:
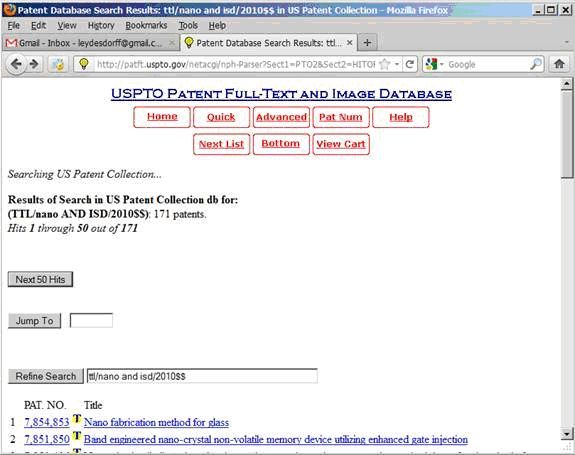
Figure 2: Screen of results page at USPTO.
Click in this screen on the button “Next 50 Hits” (because the format of the first 50 hits is deviant). Enter then into one of the patents (by clicking on the name) and copy the search string at the top of the screen into uspto1.exe when prompted for a search string. It is not important which patent is used, as long as the sequence number is larger than 50; the search string will be parsed by the program. Feed also the number of 171 into the search when prompted for the number of patents. (A lower number is also ok, but a higher number may lead to an error message disturbing the flow of the programs.)
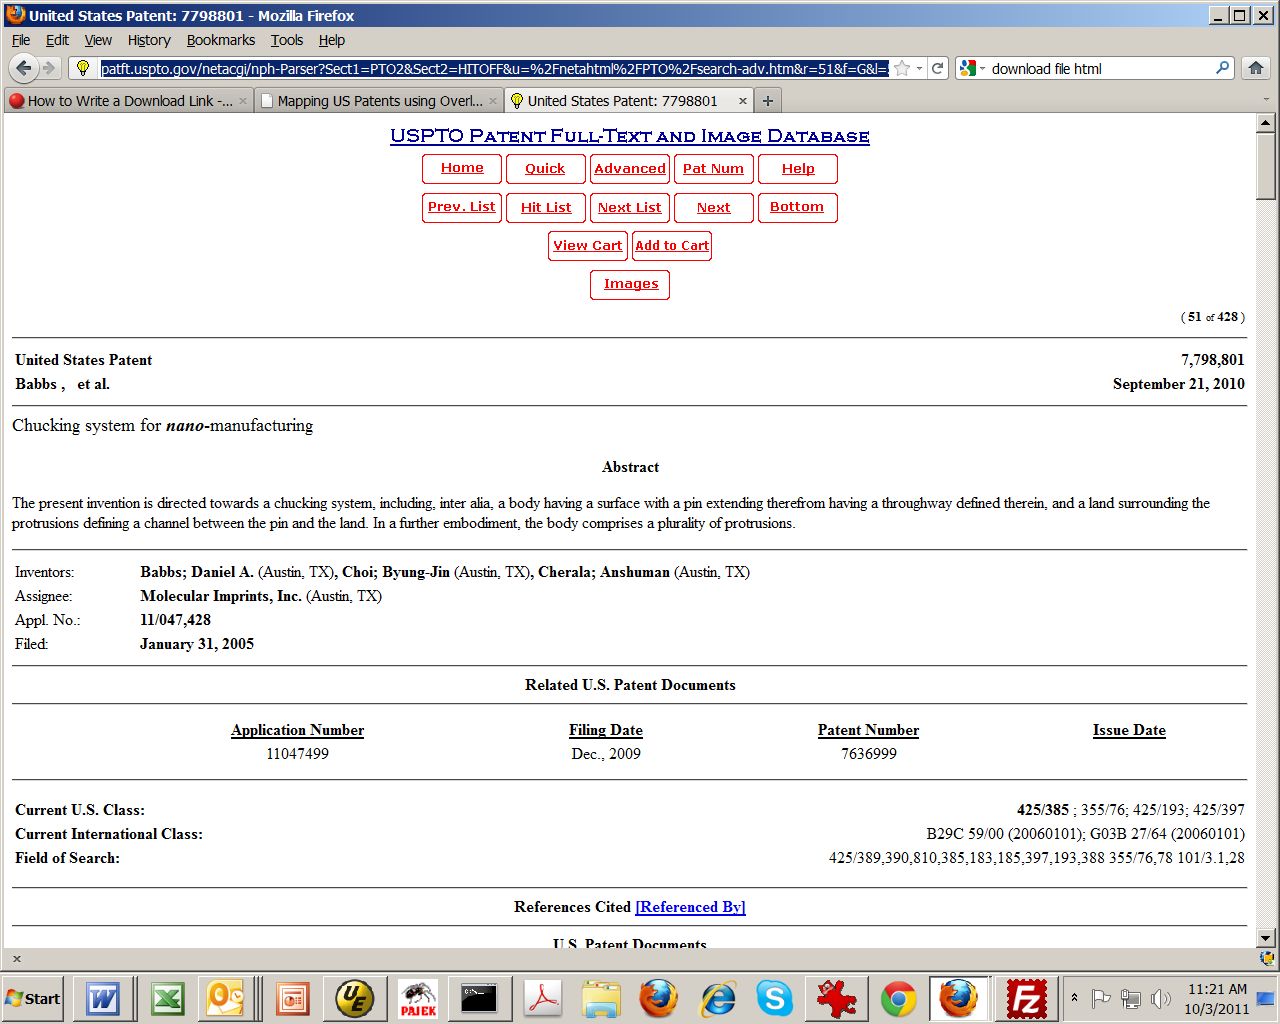
Figure 3: html-display of a US patent.
As follows:
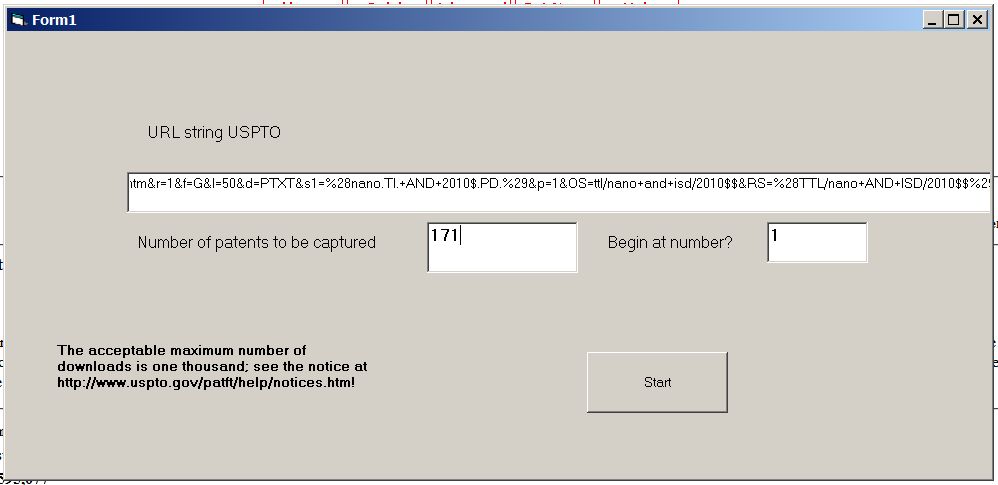
Figure 4: Opening screen of USPTO1.exe (also accessible from IPC.exe).
IPC.exe will thereupon download the (in this case, 171) patents (as p1.htm, p2.htm, …, etc.) and organize the information in these files into relational databases (as explained in more detail at http://www.leydesdorff.net/indicators/lesson5.htm. These relational databases (in .dbf format) can also be opened in Excel or related using MS Access.)
The program produces the outputfiles “vos3.txt” and “vos4.txt” which can directly be read into VOSViewer. VOSViewer can be downloaded from here. Vos3.txt provides the overlay at the 3-digit level of IPC, and vos4.txt the overlay at the 4-digit level.
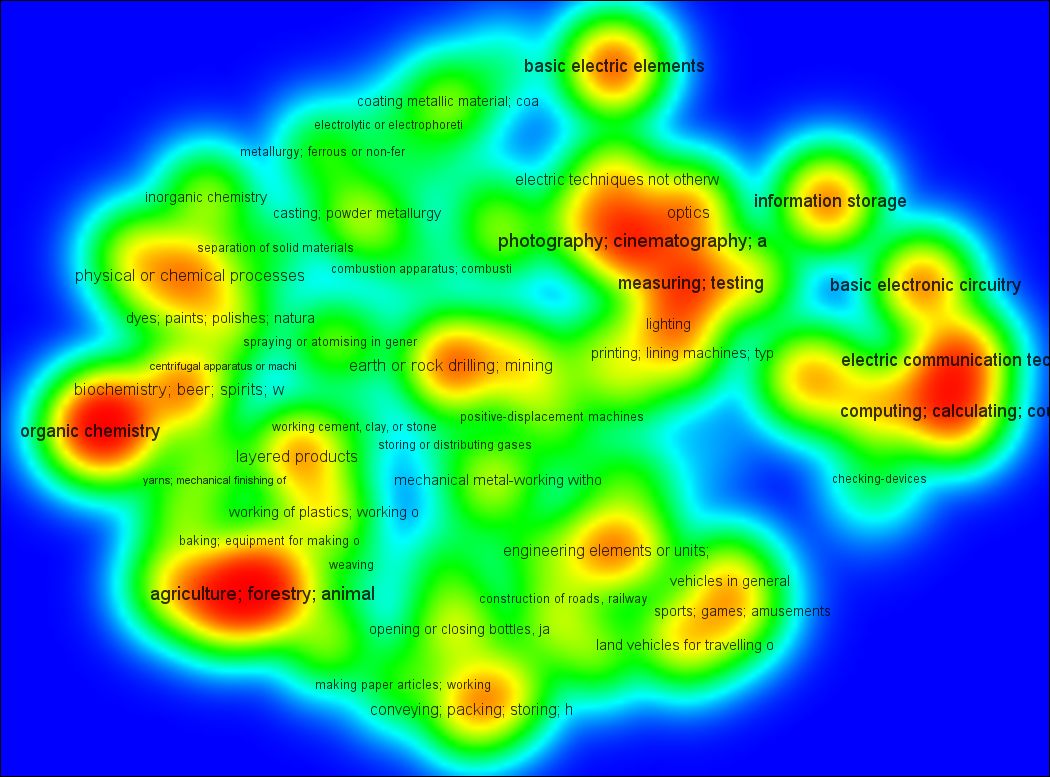
Figure 5: Heat map of 3,028 IPC classes attributed to 1,908 US patents at the 3-digit level, with an inventor in the Netherlands, and publication date in 2007 (map file available from here; see Leydesdorff & Bornmann, 2012, pp. 1446 ff.). This map can be accessed interactively from here.
The files “ipc3.txt” and “ipc4.txt” provide input files to VOSViewer with basemaps at the 3- and 4-digit levels, respectively. Note that these files for basemaps are "weighted", whereas the overlay files use "normalized weights"; see the manual available within VOSViewer for details and other options.
The USPTO provides a warning (at http://www.uspto.gov/patft/help/notices.htm) stating that downloads above 1,000 may lead to banning your IP address for further downloading. I disclaim any responsibility for this. The routine uspto1.exe allows for beginning a next search at number 1,001. If one starts above 1000 for this reason, one should use uspto1.exe directly, and not call it from ipc.exe or appl_ipc.exe because then the savings from previous runs are deleted.
Furthermore, these programs do not control for misspellings in the USPTO database itself. Misspelled IPC codes are not included in the overlay, but the full set of IPC codes in the patents can be found by analyzing the file intclass.dbf and (concatenated) in ti.dbf. IPC codes in USPTO patents are read as a string until a length of 1,000 characters, and the semicolon is considered as the relevant delimiter. Patents may contain more than 20 IPC categories; the contributions are normalized (using 1/N) so that the weight adds up to 1 for each patent. The file vos.dbf contains both the weights and the counts; first for the 124 3-digit codes and thereafter for 630 4-digit codes.
The files vos3.txt and vos4.txt (input for VOSViewer) can be changed in a text editor or in Excel. One can replace the clustering (and hence coloring) easiest in Excel.
See for the full paper with more explanation at http://arxiv.org/abs/1210.6456 .
The complete citation matrices, IPC-codes, and variable names can be retrieved from here: ipc3.xlsx and ipc4.xlsx
Extensions to Pajek
In addition to input files for VOSViewer, both ipc.exe and appl_ipc.exe make vector and cluster files for basemaps using Pajek. Pajek allows for more advanced manipulation of the files and network statistics (e.g., centrality measures). The basemaps are derived from the cosine-normalized similarity matrices (cos_ipc3.dbf and cos_ipc4.dbf; (Right-click for saving if necessary.) by setting a threshold at cosine > 0.2; the grouping was based on the community-finding algorithm of Blondel et al. (2008) as available in Pajek. (The user can change both the partitioning and the layout within Pajek.)
The Pajek project files (ipc3.paj and ipc4.paj) can be read into Pajek by using the key <F1> from within the program. In addition to vos3.txt and vos4.txt, our routines write ipc3.vec and ipc4.vec as Pajek vector files with the same values (“weights”) for the sizes of the nodes as above used for VOSViewer (fractional counts of patents): Draw> First Network + First Partition + First Vector).
The files ipc3.cls and ipc4.cls are Pajek cluster files. These can be used for exclusive labeling of the patents under study using in the Draw menu> Options> Mark Vertices Using> Mark Cluster Only. For further instruction see De Nooy et al. (2009); Leydesdorff & Rafols (2012); and http://www.leydesdorff.net/overlaytoolkit .

Figure 6: Equivalent map of Figure 5 using Pajek: 1,908 US patents with an inventor in the Netherlands, and publication date in 2007 at the 3-digit level; 3018 IPC classes. Layout according to Kamada & Kawai (1989); coloring according to Blondel et al. (2008); one community (nr. 9) is labeled.
For straightforward applications, we advise using VOSViewer; it is much simpler than Pajek. Pajek is for more advanced users. As noted, vos.dbf contains the quantitative information in a format suited for statistical analysis in SPSS.
Rao-Stirling diversity
The cosine-normalized similarity matrices for the base maps are available as cos_ipc3.dbf and cos_ipc4.dbf, respectively. (click for saving if necessary.) When both these files are downloaded in the same folder as the main program and the patents, the routine writes a file ipc_rao.txt in which the Rao-Stirling diversity at both the 3-digit and 4-digit level is specified for the set of patents under study. (If one fails to read .dbf in Excel, one can use Open Office for this.)
The distance between two classes Dij is defined as (1 – cosine); Diversity = Σi≠j pi pj Dij (Rao, 1992; Stirling, 2007). Note that this measure is summed for both the upper and lower triangle of the matrix (see Leydesdorff & Rafols (2011) for more details).
Dynamic extension and animation (September 2013):
The static maps made for US patents in terms of geographical addresses (at http://www.leydesdorff.net/patentmaps) or IPC categories (at http://www.leydesdorff.net/ipcmaps) can be converted into dynamic animations using the filing years and the corresponding routines usptoyr.exe and ipcyr.exe, respectively. The two programs run on the downloaded sets first parsed at the aggregated level by uspto2.exe and ipc.exe, respectively. Both routines use the filing dates for organizing the files into years. The user gets the option to specify a time-window in terms of number of years. For example, if one specifies 3 years and the first patents are from 1984, the respective output file for 1984 will also contain 1985 and 1986; and the next one for 1985 includes patents of 1986 and 1987. This enables users to dampen the variation.
See for more information at http://www.leydesdorff.net/software/patentmaps/dynamic . An example can be found at http://www.leydesdorff.net/photovoltaic/cuinse2/index.htm (for the geographic diffusion) and at http://www.leydesdorff.net/photovoltaic/cuinse2/cuinse2.ppsx (for the diffusion in terms of IPC categories).
References:
- Rao, C. R. (1982). Diversity: Its measurement, decomposition, apportionment and analysis. Sankhy : The Indian Journal of Statistics, Series A, 44(1), 1-22.
- Blondel, V. D., Guillaume, J. L., Lambiotte, R., & Lefebvre, E. (2008). Fast unfolding of communities in large networks. Journal of Statistical Mechanics: Theory and Experiment, 8(10), 10008.
- de Nooy, W., Mrvar, A., & Batgelj, V. (2011). Exploratory Social Network Analysis with Pajek (2nd Edition). New York, NY: Cambridge University Press.
- Leydesdorff, L., & Rafols, I. (2012). Interactive Overlays: A New Method for Generating Global Journal Maps from Web-of-Science Data. Journal of Informetrics, 6(3), 318-332.
- Leydesdorff, L., & Rafols, I. (2011). Indicators of the Interdisciplinarity of Journals: Diversity, Centrality, and Citations. Journal of Informetrics, 5(1), 87-100.
- Leydesdorff, L., & Bornmann, L. (2012). Mapping (USPTO) Patent Data using Overlays to Google Maps. Journal of the American Society for Information Science and Technology, 63(7), 1442-1458; [software].
- Stirling, A. (2007). A general framework for analysing diversity in science, technology and society. Journal of the Royal Society Interface, 4(15), 707-719.
** updated on March 1, 2013; ipc4.txt, ipc4.xlsx, cos_ipc4.dbf, and ipc.dbf were replaced because of a correction of previous error in the data.