Thirteen Dutch universities and ten principles in the Leiden Ranking 2017.
This is a reaction to https://www.cwts.nl/blog?article=n-r2q274&title=ten-principles-for-the-responsible-use-of-university-rankings
Under principle 6, you formulate as follows: “To some extent it may be possible to quantify uncertainty in university rankings (e.g., using stability intervals in the Leiden Ranking), but to a large extent one needs to make an intuitive assessment of this uncertainty. In practice, this means that it is best not to pay attention to small performance differences between universities.”
It seems to me of some relevance whether minor differences are significant or not. The results can be counter-intuitive. At the occasion of the Leiden Ranking 2011, Lutz Bornmann and I therefore developed a tool in Excel that enables the user to test (i) the difference between two universities on its significance and (ii) for each university the difference between its participation in the top-10% cited publications versus the ceteris-paribus expectation of 10% participation (Leydesdorff & Bornmann, 2012). Does the university perform above or below expectation?
The Excel sheet containing the test can be retrieved at http://www.leydesdorff.net/leiden11/leiden11.xls . In response to concerns similar to yours about using significance tests expressed by (Cohen, 1994; Schneider, 2013; Waltman, 2016), we added effect sizes to the tool (Cohen, 1988) . However, the weights of effect sizes are more difficult to interpret than p-values indicating a significance level.
For example, one can raise the question of whether the relatively small differences among Dutch universities indicate that they can be considered as a homogenous set. This is the intuitive assessment which dominates in the Netherlands. Using the stability intervals on your website, however, one can show that there are two groups: one in the western part of the country (the “randstad”) and another in more peripheral regions with significantly lower scores in terms of the top-10 publication (PP10). Figure 1 shows the division.
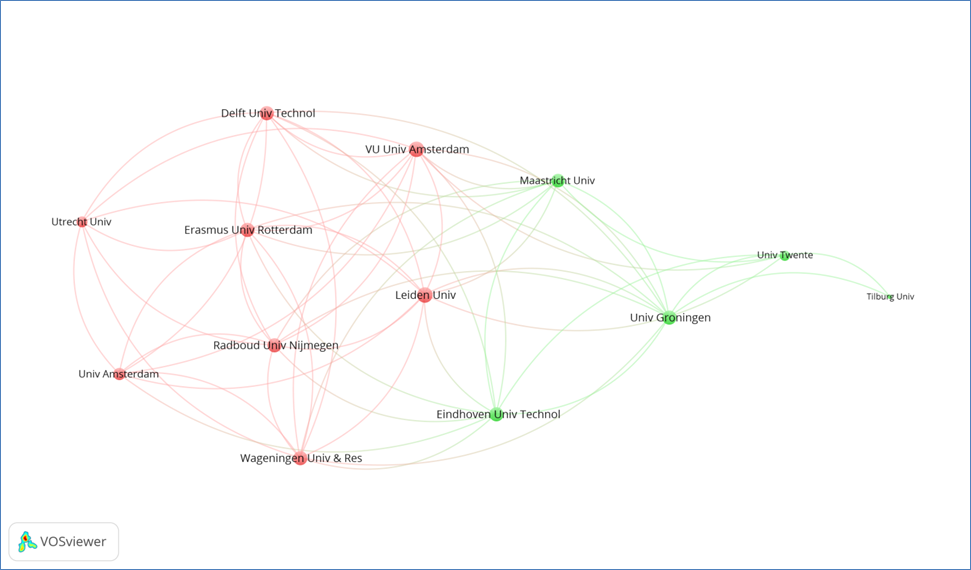
Figure 1: Thirteen Dutch universities grouped into two statistically homogenous sets on the basis of the Leiden Rankings 2017. Stability intervals used as methodology. (If not visible, see the version at http://www.leydesdorff.net/leiden17/index.htm )
You add to principle 6 as follows: “Likewise, minor fluctuations in the performance of a university over time can best be ignored. The focus instead should be on structural patterns emerging from time trends.”
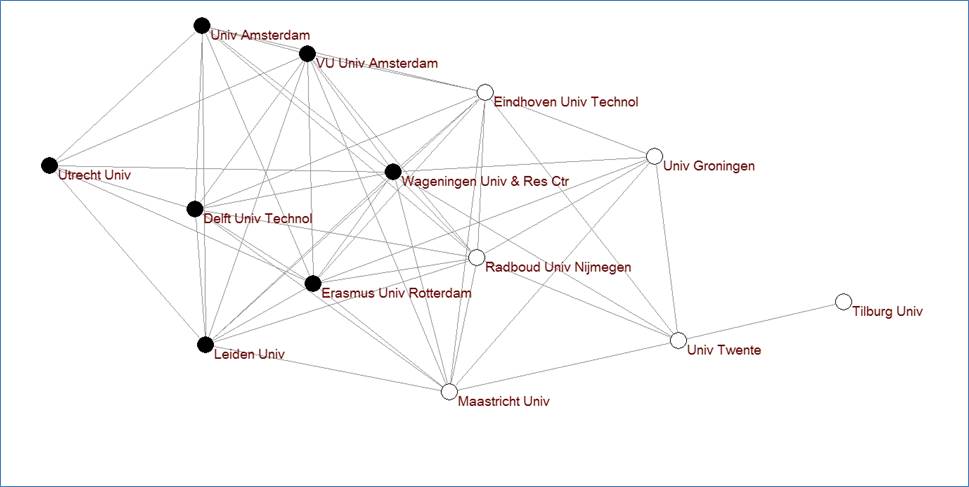
Figure 2: Thirteen Dutch universities grouped into two statistically homogenous sets on the basis of the Leiden Rankings 2016. Methodology: z-test. (If not visible, see the version at http://www.leydesdorff.net/leiden17/index.htm )
Using the z-test in the excel sheet, Dolfsma & Leydesdorff (2016) showed a similar pattern in 2016 (Figure 2). Only the position of the Radboud University in Nijmegen was changed: in 2017, this university is part of the core group. Using two subsequent years and two different methods, therefore, we have robust results and may conclude that there is a statistically significant division in two groups among universities in the Netherlands. This conclusion can have policy implications since it is counter-intuitive.
In summary, the careful elaboration of statistical testing enriches the Leiden Rankings which can without such testing be considered as descriptive statistics.
References
Cohen, J. (1988). Statistical power analysis for the behavioral sciences (2nd ed.). Hillsdale, NJ: Lawrence Erlbaum.
Cohen, J. (1994). The Earth is Round (p <. 05). American psychologist, 49(12), 997-1003.
Dolfsma, W., & Leydesdorff, L. (2016). Universitaire en Economische Pieken (Mountains and Valleys in University and Economics Research in the Netherlands). ESB, 101((4742) 13 oktober 2016), 678-681; available at https://papers.ssrn.com/sol3/papers.cfm?abstract_id=2849151
Schneider, J. W. (2013). Caveats for using statistical significance test in research assessments. Journal of Informetrics, 7(1), 50-62.
Waltman, L. (2016). Conceptual difficulties in the use of statistical inference in citation analysis. arXiv preprint arXiv:1612.03285.
Amsterdam, May 19, 2017.