|
Homepage | Publications | Software; data | Courseware; indicators | Animation | Geo | Search website (Google) |
Mapping PubMed Data in terms of Medical Subject Headings (MeSH)
Journal of the American Society of Information Science & Technology (in press)
<preprint version at http://arxiv.org/abs/1203.1006>
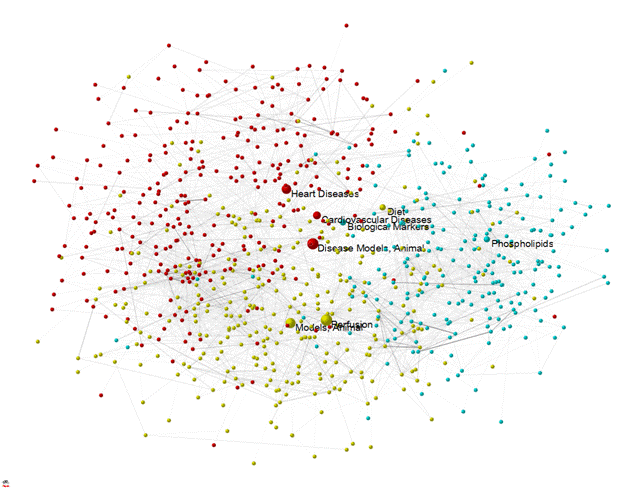
Figure 1: 153 documents—using “Opthof” as author on November 10, 2010—downloaded from PubMed at http://www.ncbi.nlm.nih.gov/pubmed/advanced: 1677 occurrences of 18 MeSH categories mapped among 822 MeSH categories at the second level in the basemap.
Figure 1 provides an example of an overlay using a (cosine-based) map of 822 second-level Medical Subject Headings (MeSH) used for “Diseases” (Category C; red nodes), “Drugs and Chemicals” (Category D; blue), and “Techniques and Equipment” (Category E; yellow), in 2010 (N = 923,086 documents). Such overlays can be generated as follows:
- Download any dataset (with any possible search string)
from the user interface at http://www.ncbi.nlm.nih.gov/pubmed/advanced
. At the results page thereafter, select under “Send to” the format option
MEDLINE and download to a file which has to be (re)named “data.txt”;
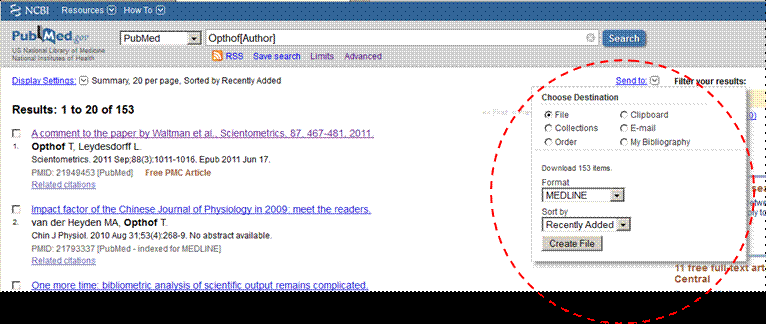
Figure 2: Download in the MedLine format to file as indicated in the red-dotted circle.
- Download into the same folder the file pubmed.exe from here; one also needs in the same directory the file <pubmed.dbf>;
- Pubmed.exe reads data.txt and produces the files “pajek.vec” and “vos.txt”. “Pajek.vec” contains a vector file which can be used for drawing an overlay in Pajek; “vos.txt” is a so-called “map” file which can be read by VOSViewer. Both these programs are network visualization programs that are freely available at the internet.
- “vos.txt” can directly be read into VOSViewer. The result for the above file are shown in VOSViewer as follows:
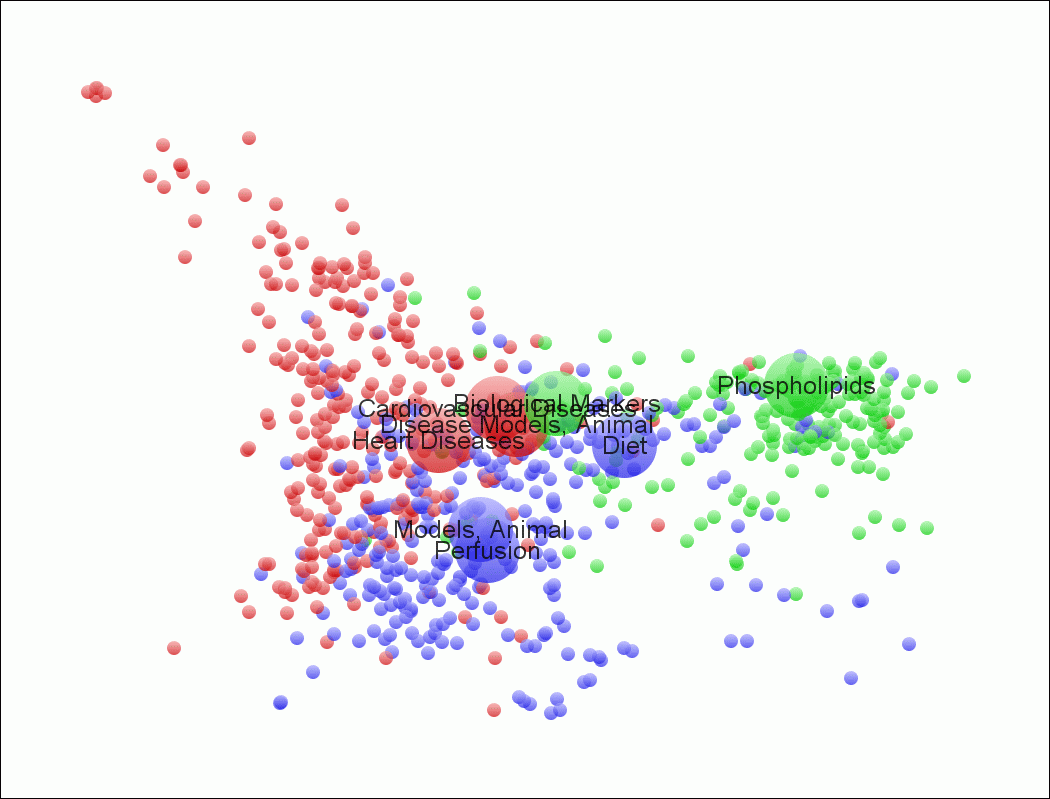
Figure 3: Map otherwise equivalent to Figure 1, but drawn using “vos.txt” as input to VOSViewer.
- Using Pajek one should first read the project file pubmed.paj (using F1); this file can be downloaded from here. After reading this file in Pajek (by using F1 or File > Pajek project file), the file “pajek.vec” can be read additionally using File > Vector > Read. Using Draw > Draw-Partition-Vector, the overlay is then obtained. The labels (in 2010) can be toggled on and off (under Options > Mark Vertices).
- If one wishes labels only for the categories used in the analysis (as in Figure 1), one has to create in the main window of Pajek first a partition from the vector and then a cluster from the partition, since only clusters can be labeled separately in Pajek. The steps for this are as follows: in the main menu under Vector > Make Partition > by Intervals > First Threshold and Steps> [accept default values]. Under Partition > Make cluster > [2-*]. Return thereafter to the previous Partition 1, and repeat Draw > Draw-Partition-Vector. Given the cluster, it is possible to select under Options > Mark Vertices > Mark Cluster only.
- The figure can be exported to .bmp or more advanced to .svg. The latter format can be embellished using InkScape; see lesson 6 about how to embellish a Pajek output file.
- The cluster can be extracted from the larger file for further (e.g., statistical) analysis in Pajek using Operations > Extract from Network > Partition 2-* or (equivalently) Cluster.
- The sizes of the nodes are proportional to the log2 of the number of occurrences of the MeSH. This can be changed in the file pubmed.dbf; this file contains the numerical values in the field number after each run.
- The routine pubmed.exe additionally produces the file matrix.txt that contains the occurrence matrix of the documents in the download (as cases in the rows) and the MeSH classifications as variables in the columns. These files are not constrained to only “diseases”, “drugs & chemicals”, or “techniques & equipment”, but contain all MeSH categories in the download, at the second level. The matrix can be read, for example, into SPSS; the file labels.sps is provided in SPSS syntax for naming the variables from within SPSS.
- The file vos.txt can also be made to webstart from the internet. The following link, for example, webstarts Figure 3 at http://www.vosviewer.com/vosviewer.php?map=http://www.leydesdorff.net/pubmed/vos.txt .
Interface with Web-of-Science files
Using a download from the Web-of-Science (Science Citation Index, etc.), one can use this program isi.exe for generating a file “batch.txt”. The file from the Web-of-Science (WoS) has to be saved first in the default (tagged) format and renamed “data.txt”; see for further instruction at http://www.leydesdorff.net/software/isi . The file “batch.txt” can be uploaded at the NCBI Batch Citation Matcher of PubMed. One received output by email. After saving this output as an ASCII textfile under the name “match.txt” one can use match.exe from here for producing a file “pmid.txt”. (PMID is an abbreviation for PubMed Indicator.) The content of the output of match.exe in pmid.txt can be copied and pasted into the advanced search engine of PubMed at http://www.ncbi.nlm.nih.gov/pubmed/advanced . The results of the search can be processed as above.
If the file core.dbf (output of isi.exe) is still available in the same folder, the output of the matching is stored in the field “pmid” within this file (for future processing).
Interface with Scopus files
Scopus contains a field “PubMed ID”. When one exports the set from Scopus in the format “comma separated file” including this field, one can import the resulting file scopus.csv into Excel and copy the column with the heading “PubMed ID” into a text file. If one saves this file as “match.txt”, the routine match.exe will generate the file “pmid.txt” as above.
Further extension
The files pubplus.exe and pubplus.dbf have the same functionality as pubmed.exe and pubmed.dbf discussed above, but differently from the latter, all categories at deeper levels of the hierarchy than the second one are brought under the latter as a common denominator. Pubmed.exe uses exclusively MeSH terms of the second category.
Amsterdam,
November 17, 2011.