|
Homepage | Publications | Software | Courseware; indicators | Animation | Geo | Search website (Google) |
Overlay.exe for data from Scopus
See for more explanation: Loet Leydesdorff, Félix de Moya-Anegón, and Vicente P. Guerrero-Bote, Journal Maps, Interactive Overlays, and the Measurement of Interdisciplinarity on the Basis of Scopus Data (1996-2012) [software], Journal of the Association of Information Science and Technology 66(5) (2015) 1001-1016; preprint at http://arxiv.org/abs/1310.4966 .
The base map of aggregated citation relations among 19,600 journals in Scopus during 1996-2012 is as follows:
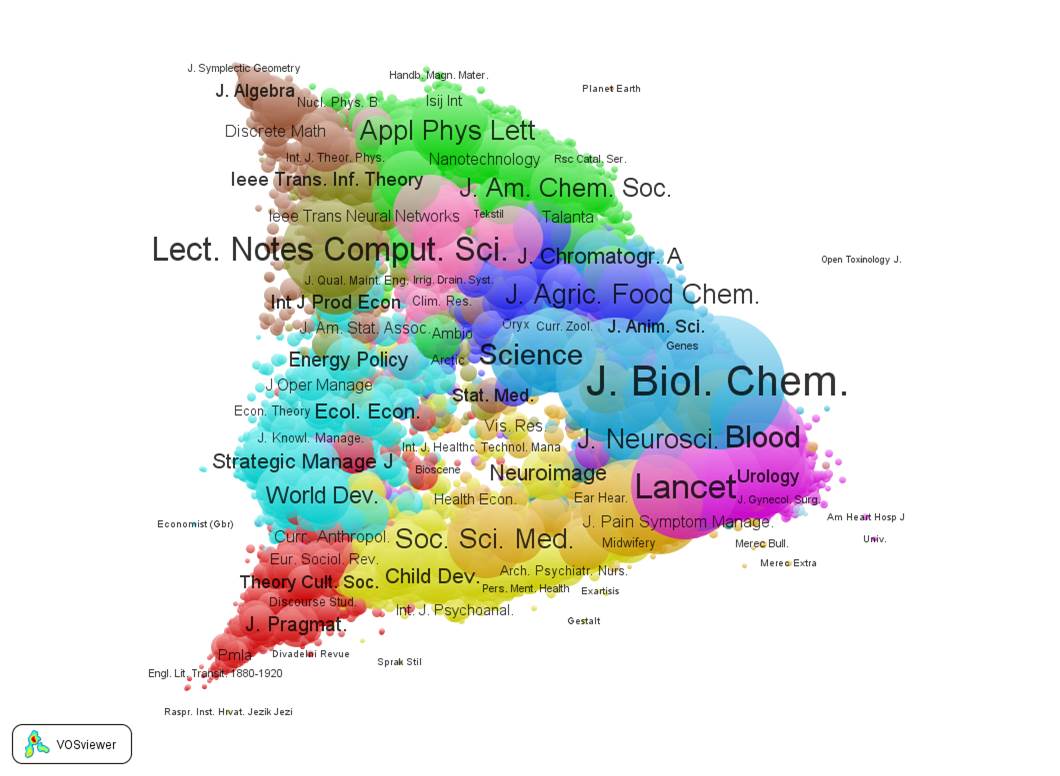
Figure 1: Base map of aggregated citation relations among 19,600 journals included in Scopus 1996-2012; colors correspond to 27 communities distinguished by VOSviewer; This map can be web-started at http://www.Vosviewer.com/Vosviewer.php?map=http://www.leydesdorff.net/scopus_ovl/basemap.txt
One can generate an overlay for any set downloaded from Scopus as follows:
· Search in Scopus (advanced or basic); for example, using the search string ‘TITLE(“humanities computing”) OR TITLE(“computational humanities”) OR TITLE(“digital humanities”) OR TITLE(“ehumanities”) OR TITLE(“e-humanities”)’ provided 114 documents on October 8, 2013 [270 documents on Dec. 10, 2015];
· Make a possible selection of records among the retrieved documents or tick “All”;
· Click on “Export”;
· Among the output formats, choose the “RIS format (Reference Manager, Procite, Endnote)” and “Specify fields to be exported”;
· Only “Source titles” should be exported; untick all other fields;
· Click on “Export”: the file “scopus.ris” can be saved; for example, for the 270 records mentioned;
· Save the file “scopus.ris” in the same folder as the routine overlay.exe and the file with the mapping information scopus.dbf (right-click for saving this file). One can paste different (e.g., sequential) output files of Scopus into a single file, but the routine expects an input file with the name “scopus.ris”.
· One can now run overlay.exe in that same folder; preferably from the C-prompt; (using the C-prompt, one obtains error messages);
· The file “overlay.txt” (e.g., ehum.txt) is a map file that can be opened in VOSviewer;
· Rao-Stirling diversity is stored in the file “rao.txt” and shown on the screen; overlay.dbf contains the information such as the number of publications in each journal.
The resulting overlay map reads as follows:
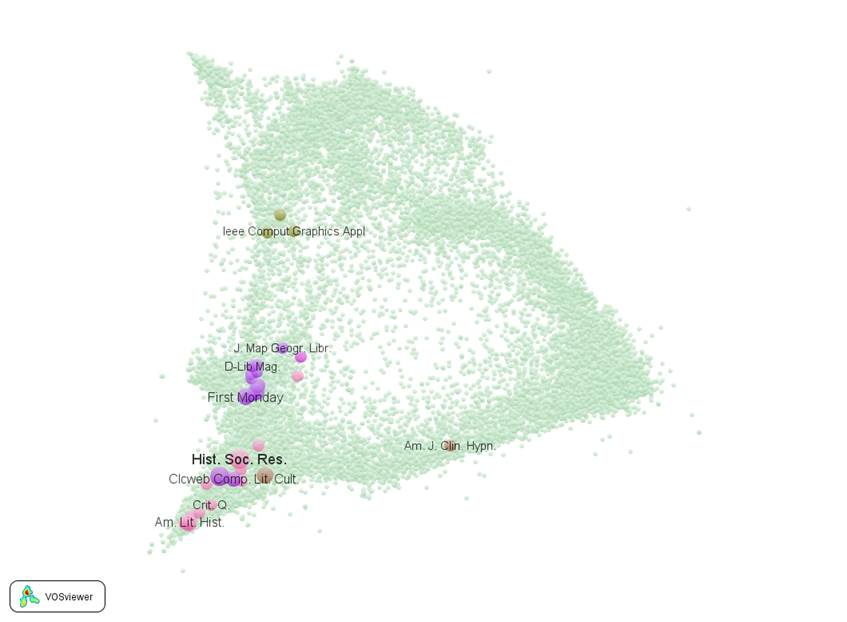
Figure 2: Overlay of 114 documents with the search string ‘TITLE(“humanities computing”) OR TITLE(“computational humanities”) OR TITLE(“digital humanities”) OR TITLE(“ehumanities”) OR TITLE(“e-humanities”)’ in Scopus; Rao-Stirling diversity = 0.1244. This map can be web-started at http://www.Vosviewer.com/Vosviewer.php?map=http://www.leydesdorff.net/scopus_ovl/ehum.txt&label_size=1.35
See for more explanation: Loet Leydesdorff, Félix de Moya-Anegón, and Vicente P. Guerrero-Bote, Journal Maps, Interactive Overlays, and the Measurement of Interdisciplinarity on the Basis of Scopus Data (1996-2012) [software], Journal of the Association of Information Science and Technology 66(5) (2015) 1001-1016; preprint at http://arxiv.org/abs/1310.4966 .
Updated: Dec. 10, 2015.