|
Homepage | Publications | Software; data | Courseware; indicators | Search website (Google) |
Interactive Overlays: A New Method for Generating
Global Journal Maps from Web-of-Science Data
[A new version based on 2011 data is available from here.]
![]()
Loet Leydesdorff [1] & Ismael Rafols [2]
Abstract
Recent advances in methods and techniques enable us to develop an interactive overlay to the global map of science based on aggregated citation relations among the 9,162 journals contained in the Science Citation Index and Social Science Citation Index 2009 combined. The resulting mapping is provided by VOSViewer. We first discuss the pros and cons of the various options: cited versus citing, multidimensional scaling versus spring-embedded algorithms, VOSViewer versus Gephi, and the various clustering algorithms and similarity criteria. Our approach focuses on the positions of journals in the multidimensional space spanned by the aggregated journal-journal citations. A number of choices can be left to the user, but we provide default options reflecting our preferences. Some examples are also provided; for example, the potential of using this technique to assess the interdisciplinarity of organizations and/or document sets.
Instruction for the construction of journal overlay maps:
Two programs are available online at http://www.leydesdorff.net/journalmaps/citing.exe and http://www.leydesdorff.net/journalmaps/cited.exe, respectively, for processing a file containing downloaded data from the WoS. These .exe files also need the table file citing.dbf and/or cited.dbf, respectively, in the same folder. (The table files can be downloaded from the same page; right-click on the link for saving (e.g., in Firefox) if necessary.) In addition to the coordinate information for the maps, the full titles of the journals as provided by the JCR are listed in these files. The titles of the journals are used as keys for the matching. (In the case of an unforeseen mismatch one is advised to adapt the title in the corresponding table file.
When the programs and tables are brought into a single folder with the input file, which is downloaded from the WoS and renamed “data.txt,” an output file can be generated. This file is called either “cited.txt” or “citing.txt” depending on the routine in question. These files can be used as input to VOSViewer and thus visualized. Figure 6, for example, shows the publication profile of the first author of this article using the “citing” map for the projection.
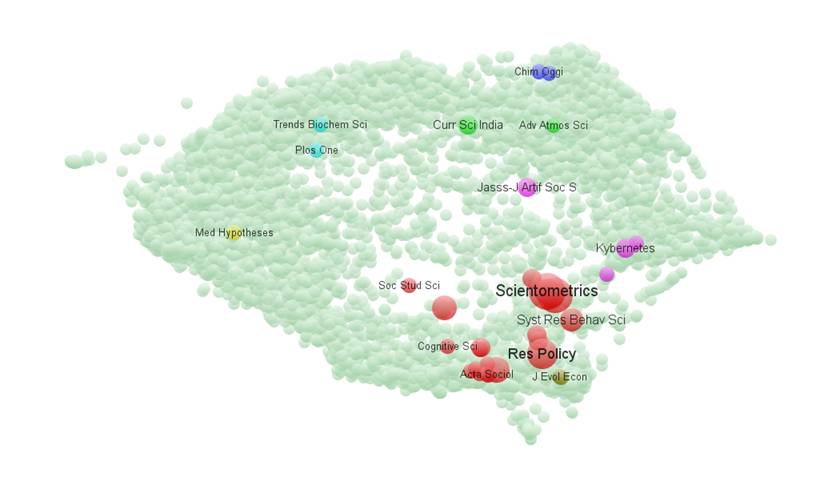
Figure 6: Overlay map of 168 articles published by the first author
(Leydesdorff) in journals included in the ISI journal set.
[1] Amsterdam School of Communications Research (ASCoR), University of Amsterdam, Kloveniersburgwal 48, 1012 CX Amsterdam, The Netherlands; loet@leydesdorff.net; http://www.leydesdorff.net .
[2] SPRU (Science and Technology Policy
Research), University of Sussex, Freeman Centre, Falmer
Brighton, East Sussex BN1 9QE, United Kingdom; i.rafols@sussex.ac.uk .