|
Homepage | Publications | Software | Indicators | Animation | Geo | Blog | Search website (Google) |
The measurement of “synergy” and “interdisciplinarity”
Journal of the Association for Information Science and Technology (in print).
<version 22 August 2020>
Loet Leydesdorff,[1]* and Inga Ivanova[2]
A system is more than the sum of its parts; the difference can be considered as a result of synergy among the parts. Synergy among the parts provides new options. A system which is no longer generating new options is dead-locked. New options are more important for innovation than past performance.
The program is based on:
Loet Leydesdorff & Inga Ivanova, The Measurement of “Interdisciplinarity” and “Synergy” in Scientific and Extra-Scientific Collaborations Journal of the Association for Information Science and Technology (in print). The stylized model discussed in the article is based on this data; the empirical case on this data “this data.
This new version of the program additionally computes the various interdisciplinarity and diversity indicators specified in:
· Loet Leydesdorff, Caroline S. Wagner, and Lutz Bornmann, Interdisciplinarity as Diversity in Citation Patterns among Journals: Rao-Stirling Diversity, Relative Variety, and the Gini coefficient. Journal of Informetrics 13(1) (2019) 255-269; https://doi.org/10.1016/j.joi.2018.12.006
· Loet Leydesdorff, Caroline S. Wagner, and Lutz Bornmann, Diversity Measurement: Steps towards the Measurement of Interdisciplinarity? Journal of Informetrics 13 (3) (2019) 904-905 ; https://doi.org/10.1016/j.joi.2019.03.016
The outcome is written into the file synergy.dbf. See also at http://www.leydesdorff.net/software/mode2div/index.htm for the previous (dos-based) version. The current version is written in VB6 and therefore much faster. There are no size limitations in the software. (However, there may be in the hardware.)
The routing Syn3_vb.exe
Syn3_vb.exe computes redundancies among all possible permutations of three column vectors in a matrix. The .exe-file must be downloaded into the folder “C:\temp” on a local (hard-)disk. Similarly, one needs in this folder syn3.exe and the data matrix in .csv-format; that is, with comma-separated variables. Choose the plain ascii (or msdos) option and the extension .txt. The filename should be no longer than 8 characters + “.txt”. Make sure that the file has no headers and no empty lines.
The user is first asked for the file name of the data file. Provide the name without the extension .txt (e.g., “scientom”). The input file should contain only column vectors (fields) with numerical values. No headers! A column with only zeros with lead to an error message because this can lead to a division by zero.
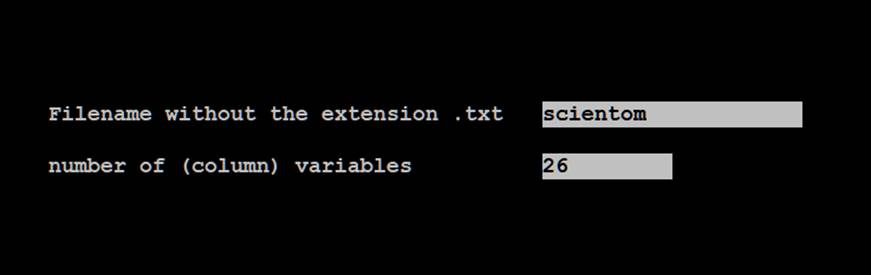
Secondly, one is prompted for the number of variables (columns) in the input file. For example, this is four in the case of “toy.txt”, and 26 in “scientom.txt”.
Syn3_vb.exe calls syn3.exe.This program asks the user to confirm by clicking on “Run”.
The results of the computation (which may take a while) are stored in the file results.txt (generated from scratch), but then further processed automatically into files with redundancy values (T123) for the nodes and the links; in the files t_nodes.dbf and t_edges.dbf, respectively.
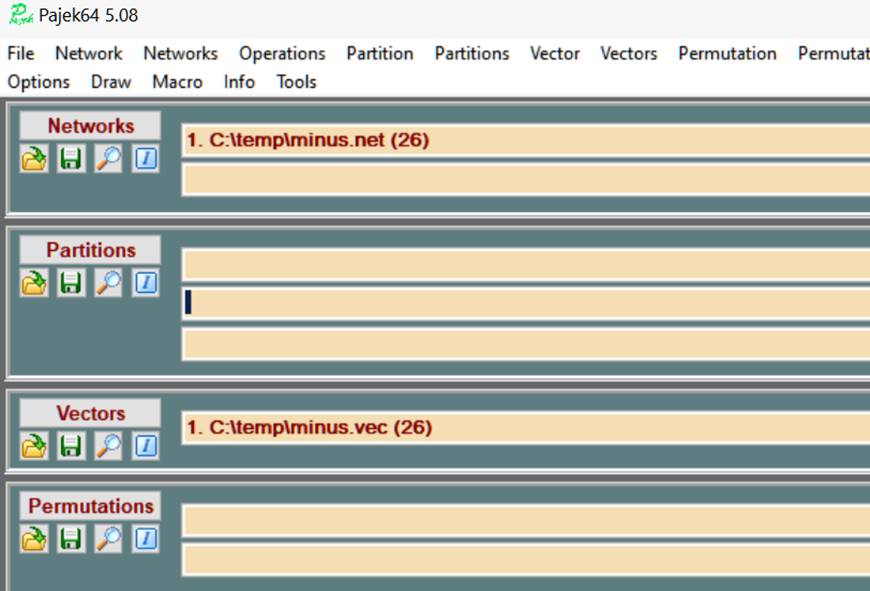
The output is also written into a file minus.net in the Pajek format; the file minus.vec contains the redundancy values as in t_nodes.dbf. (A routine to transform .dbf into .csv is provided at https://www.leydesdorff.net/software/dbf2csv/.)
If a file labels.dbf is present with at least a field named “label”, it is used for labeling the output. If absent, a file “labels.dbf” is generated with the labels v1, v2, …, etc. The labels are provided in ascending order to the column variables from left to right. One can visualize the largest component of this synergy network using VOSviewer, as follows:

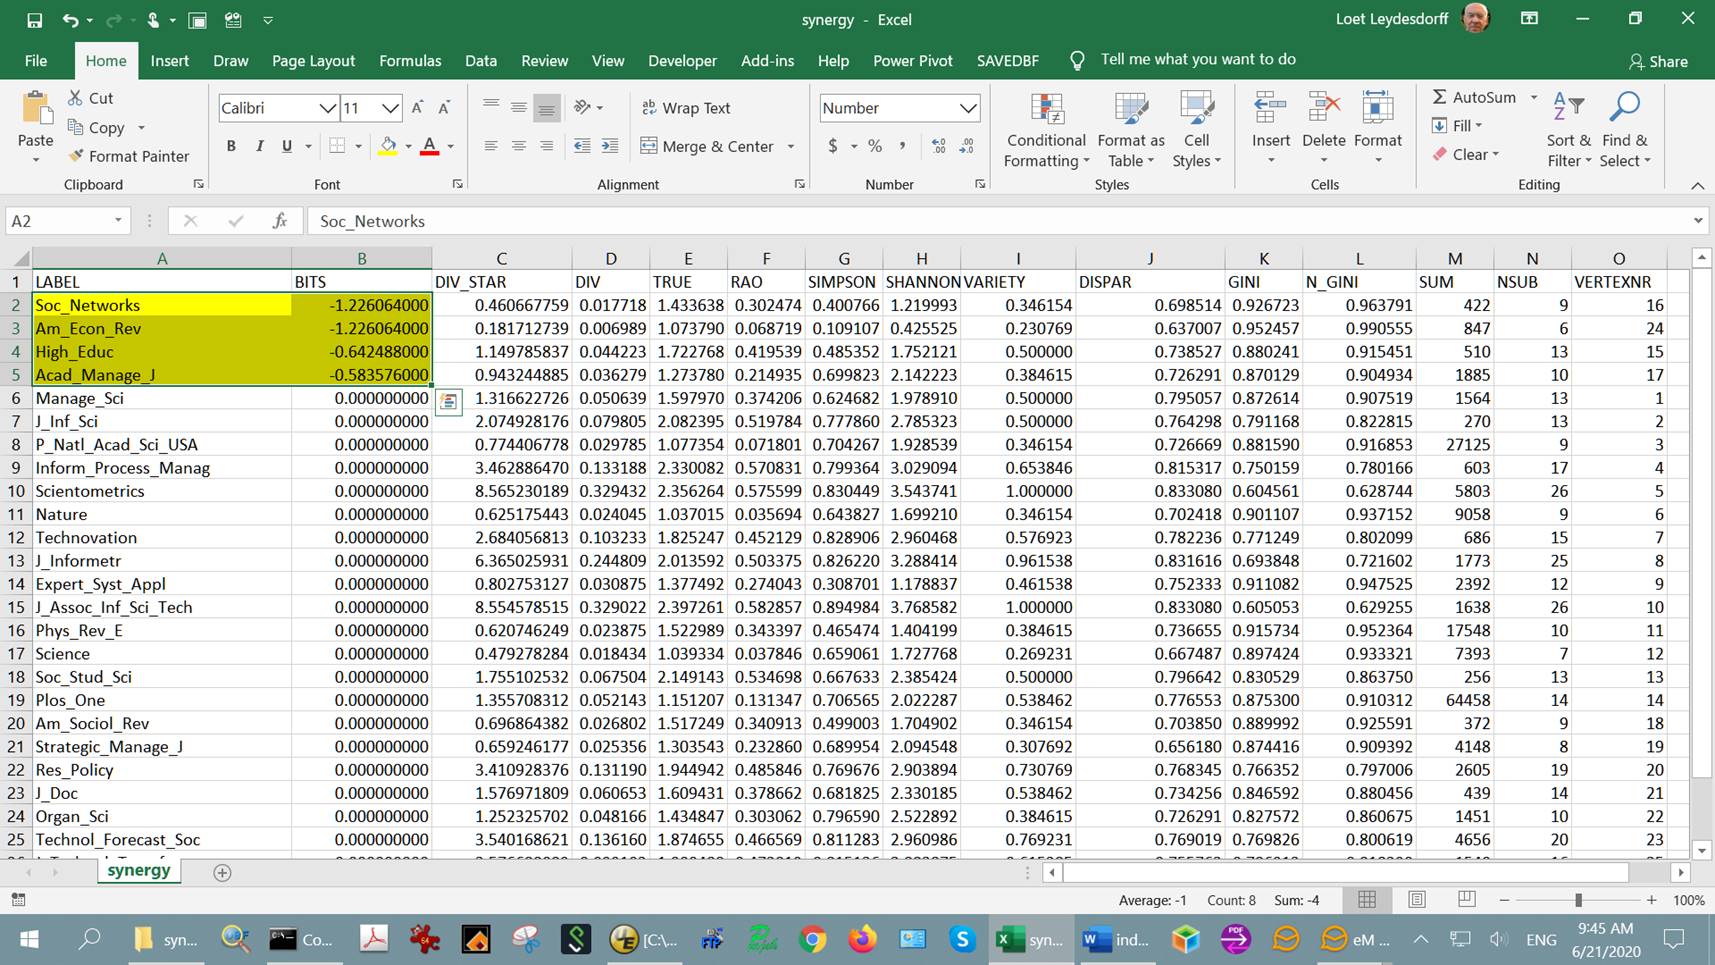
The file synergy.dbf contains the values of the diversity matrix generated by mode2div.exe, but now extended with the synergy measure in mbits of (negative) information.

If labels are available in a file labels.dbf, a file labels.csv is additionally generated.
Amsterdam, June 10, 2020.