Patent Classifications as Indicators of Intellectual Organization
Journal of the American Society for Information Science & Technology (forthcoming)
Loet Leydesdorff
Amsterdam School of Communications Research (ASCoR), University of Amsterdam
Kloveniersburgwal 48, 1012 CX Amsterdam, The Netherlands
loet@leydesdorff.net ; http://www.leydesdorff.net
Abstract
Using the 138,751 patents filed in 2006 under the Patent Cooperation Treaty, co-classification analysis is pursued on the basis of three- and four-digit codes in the International Patent Classification (IPC, 8th edition). The co-classifications among the patents enable us to analyze and visualize the relations among technologies at different levels of aggregation. The hypothesis that classifications might be considered as the organizers of patents into classes, and that therefore co-classification patterns—more than co-citation patterns—might be useful for mapping, is not corroborated. The classifications hang weakly together, even at the four-digit level; at the country level, more specificity can be made visible. However, countries are not the appropriate units of analysis because patent portfolios are largely similar in many advanced countries in terms of the classes attributed. Instead of classes, one may wish to explore the mapping of title words as a better approach to visualize the intellectual organization of patents.
Keywords: patent, classification, indicator, map, WIPO, IPC
1. Introduction
Soon after his original publication in Science about using citation indexing in scientific literature (Garfield, 1955), Garfield (1957) published a less-known paper in the Journal of the Patent Office Society entitled “Breaking the subject index barrier—a citation index for chemical patents.” Based on Shephard’s citation index in law (Adair, 1955), Garfield generalized the notion of citation indexing as a tool for mapping an associative network as distinct from a hierarchically organized index. As he stated (at p. 472):
Keeping the user in mind, the conscientious indexer will translate the terminology and phraseology of the author into a standardized and more usable form. However, the indexer is, of necessity, primarily guided by the subject content which authors provide.
The indexer also faced with a practical economic barrier cannot index with the almost infinite depth to be found in the Citation Index. The Citation Index breaks this “barrier” by presenting subject matter in bibliographical arrays which are neither alphabetical nor classified but associative.
Unlike the imposed categories of classificatory indices, associations by citation are generated by the authors and inventors themselves. The network structure emerges as a property from the aggregates of individual actions. Since this network is dynamic, it can be expected to develop self-organizing properties. Order—such as the grouping into disciplines and specialties—is the result of interaction between top-down and bottom-up dynamics (Kauffman 1993; Cilliers 1998).
Although the self-organizing dynamics of the communication can be expected to prevail in the case of scientific literature (Kuhn, 1962; Price, 1965; Luhmann, 1990; Leydesdorff, 1995), the situation for patents is very different. Patents are regulated by law; legislation is (predominantly) organized at the level of national states. Patent citations and classifications are often added by the patent examiners. Can patent citations be used to map the underlying science base of patents (Jaffe & Trajtenberg, 2002; Leydesdorff, 2004; Porter & Cunningham, 2005; Sampat, 2006)?
Citations are added to the front pages of the patents by the examiners to varying extents (Cockburn et al., 2002), and the procedures differ among national, regional, and worldwide operating offices (Criscuolo, 2004). Patent citations can also be expected to fulfill other functions such as protecting an industrial portfolio, etc. (Mogee & Kolar, 1999). Because of these legal and economic functions, patent citations have been considered from perspectives different from the mapping of their knowledge base. For example, patent citations have been used for measuring the economic value of patents (Trajtenberg, 1990; Hall et al., 2002; Sapsalis et al., 2006). This has additionally been done at the level of innovation systems or even companies (Engelsman & Van Raan, 1993, 1994; Breschi et al., 2003; Leten et al., 2007). In summary, the different contexts of innovations (the market value, the legal status, and the knowledge base) provide patent citations with a variety of meanings.
In order to focus on the science base of patents, some scholars have analyzed the so-called “non-patent literary references” (NPLR) among the patent citations (Narin & Olivastro, 1988 and 1992; Grupp & Schmoch, 1999; Leydesdorff, 2004). In a recent study, Leydesdorff & Zhou (2007) examined the disciplinary background of NPLR using the journals being cited in the case of nanotechnology patents. We found in these case studies that NPLR tend to be dominated by references to general science and professional journals. These journals cannot easily be identified with specific journal categories or disciplines (Guan & He, forthcoming).
In other words, contrary to Garfield’s (1957) idea, we may have to pay more attention to the indexing and the expected indexer effects (Healey et al., 1986). In the case of patents, indexing is part of a search process by the examiner which may lead to the addition of citations, but in any case to the careful selection of primary and secondary categories for the disclosure. The primary classes may be seen as defined areas of interest; the class title gives an indication of the content of the class (WIPO, 2006, at p. 10). The secondary classes can be viewed either as exploratory classifications (Verspagen, 2005) or as reinforcing the primary classification (Breschi et al., 2000). The subclass title indicates as precisely as possible the content of the subclass (WIPO, 2006, at p. 10). The examiners thus add intellectual content to the patent structure (Larkey, 1999). The two processes of application and evaluation are more interwoven than in the science system. Furthermore, one would expect different networks to emerge from the different constraints of procedures in the cases of national, regional, and worldwide applications.
2. Various patent databases
The database of the U.S. Patent and Trade Office (USPTO) contains all the data since 1790. Patents are retrievable from this date as image files, and after 1976 also as full text. The html-format allows us to study them in considerable detail (Leydesdorff, 2004). The European Patent Office (EPO) was established as a transnational patent office in 1973. This database is also online, but in a less accessible pdf-format. Furthermore, 135 nations (as of December 31, 2006) were signatories of the Patent Cooperation Treaty (PCT) of 1970, which mandated the World Intellectual Property Organization (WIPO) in Geneva to administer fee-based services (since 1978). This database is well organized and in the html-format. The various services enable users in member countries to file international applications for patents. Like the European Union, several world regions have established regional patent offices.
The various offices provide applicants with a number of choices which imply different procedures and timelines. For example, the USPTO operates on the basis of “first to invent,” while the EPO uses “first to file” as a criterion. If the applicant wishes to protect an invention in countries outside the country of its origin, s/he can file for a patent in each country in which protection is desired, or to a regional office (e.g., EPO), or file an international application under the Patent Cooperation Treaty procedure (OECD, 2005: 54 ff.). Various factors (e.g., the costs of patenting, the time taken to grant patents, differences in rules regarding the scope of patents, etc.) influence the decision on whether to follow one procedure or another.
This variety of (partially overlapping) procedures complicates the use of patent statistics. In the USPTO the inventor and his/her attorney are obliged to provide a list of references describing the state of the art—the so-called “duty of candor” (Michel & Bettels, 2001). EPO examiners, and not inventors or applicants, add the large majority of patent citations (Criscuolo & Verspagen, 2005, at p. 10). While in the USPTO applications are examined automatically, the EPO considers an application as a request for a “patentability search report.” These reports contain citations from patents and non-patent documents that have either been suggested by the inventor or added by the patent examiner (Criscuolo, 2004, at pp. 92f.). Applications at the WIPO for intellectual property protection under the regime of the PCT protocol require an International Search Report (ISR) and a written opinion by the examiner about the patentability of the invention (OECD, 2005, at p. 57). Although the initial investigations are usually carried out by the receiving offices, the international extension can be expected to lead to a further streamlining of the patent citations with reference to their economic value and legal protection against possible litigation in court.
From the perspective of information science and technology, patent classifications provide us with the outcomes of major investments of the patent offices to organize the patents intellectually. The International Patent Classification system (IPC8) is currently (since January 1, 2006) in its eighth edition, using a 12-digit code containing 70,000 categories (WIPO, 2006 and 2007). The European classification system (ECLA) builds on this IPC and extends the number of categories to 134,000. The USPTO has its own classification system, which has been used extensively in economic research (Jaffe & Trajtenberg, 2002). This classification scheme currently employs up to 430 classes and 140,000 subclasses.
Attempts to map patents for the purpose of analyzing economic activities in terms of the technologies involved have been moderately successful. The OECD has for this purpose defined “triadic patent families” which counteract upon “home advantage effects” in the various databases (Criscuolo, 2006). A patent is a member of a patent family if and only if it is filed at the European Patent Office (EPO), the Japanese Patent Office (JPO), and is granted by the US Patent & Trademark Office (USPTO) (Eurostat, 2006). However, this institutional integration of the different databases into a single set of files that can then also be used for normalization has hitherto remained problematic. The recent integration of the various databases (OECD, WIPO, EPO, etc.) into the framework of PATSTAT cannot be expected to resolve the problem because this relational database is developed at the institutional level (Magnani & Montesi, 2007).
Several research teams have invested in generating concordance tables between the International Standard Industrial Classification (ISIC) and the International Patent Classifications (IPC) (Evenson & Puttnam, 1988; Verspagen et al., 1994; Verspagen, 1997). In a recent validation study, Schmoch et al. (2003, at p. 58) concluded that the correlations between these tables are low. The authors cite Grupp et al. (1996, at p. 272) that “industries do not represent homogeneous technologies.” From the perspective of industrial economics, the IPC itself is mostly taken as a given because patents are considered as input indicators. The purpose of this study is to open this black box and to consider patents as outputs of the R&D system. How do the classifications map the intellectual organization of patents?
3. Classifications
While scientific publications are organized in terms of journals, the primary system for organizing patents intellectually is classifications. In a recent review of methodologies in patent statistics, Dibiaggio & Nesta (2005) argued that technology classes could be the most appropriate unit of analysis for exploiting the information contained in the patent databases. Co-classification analysis has been explored in the study of scientific literature, but in scientometrics co-classification analysis has been less successful than co-citation analysis because the classifications are imposed, while the citations are not (Todorov, 1988; Tijssen, 1992b; Spasser, 1997). From a methodological perspective, co-occurrence data (co-words, co-classifications, co-citations, etc.) can equally be used for the mapping (Leydesdorff, 1987; Tijssen, 1992a; Leydesdorff & Vaughan, 2006).
In other words, it seems worthwhile to investigate whether co-classification analysis at the level of the database can provide us with an angle for the mapping of the intellectual organization of the patents. From the perspective of information analysis, the PCT database of the World Intellectual Property Organization in Geneva has the advantage that all records are gathered according to a common standard. Furthermore, one can expect that mainly patents of a certain economic and technological value will be extended for protection beyond the domestic market. Thus, mapping these patents can be expected to show the fields of technological specialization of each country. The disadvantage remains that patents under the PCT regime are a specific subset of the total set of patents in the world. Some countries may use this route more than others. However, the PCT procedure is increasingly used for patent applications. The number of applications increased from around 24,000 in 1991 to 110,000 in 2002 (OECD, 2005, at p. 7). Currently, more than 135,000 applications are registered yearly (WIPO, 2007).
From the perspective of my research question, the problem that the PCT set is a specific subset is ameliorated by the high level of codification within this set because of the intensive development of the IPC by the WIPO. If one were unable to retrieve structure in this relatively well-organized set, then the more fuzzy sets would be even more difficult to analyze. The national, regional, and international procedures for an application under the PCT regime take approximately 30 months, but after this period the patent is designated for all the countries indicated (Figure 1). This delay is sometimes considered as an advantage because it provides the applicant with more time to decide whether or not to seek a national or regional patent.
Figure 1: Timeline for PCT procedures (Source: OECD, 2005, at p. 57)
Patent co-classifications were already mentioned in the OECD Manual of 1994 as a potential indicator of linkages among technologies (OECD, 1994, at p. 52). However, the emphasis in the literature has been on patent citations because of (1) the analogy with citations in the scientific literature, and (2) the interest in patent citations as indicators of economic value (Breschi & Lissoni, 2004). Hall et al. (2002) grouped the classes of the U.S. classification into six technological categories and 36 subcategories, but this research was not used intensively in further research for mapping the knowledge structure of patents. Breschi et al. (2002, 2003) have explored the mapping of firm portfolios and their technological coherence in terms of patent classifications. Using the cosine and other measures of similarity, these authors concluded that relevant measures of the technological proximity of the classes can be retrieved from the database (Ejermo, 2005).
4. Methods and materials
4.1. Data
Because the WIPO database of the PCT applications is fully accessible online, has worldwide coverage, and is carefully indexed using the latest version of the IPC, I decided to download one year of data, that is, the 2006 data, from this database. The downloads were done in the second week of January 2007. The dataset was fixed at that date at 138,741 patents with a publication date in 2006. Actually, 138,751 patents were retrieved, but the difference of ten patents is negligible given the large numbers.
It was decided to use publication dates instead of application dates because the applications are brought online in a moving process. Thus, the number of patents using application dates as the search code varies from day to day. For example, on 18 February 2007, 73,506 patents with application dates in 2006 were available, while this number increased to 76,237 one week later, on February 25. Even the number of patents with application dates in 2005 changed in this week from 129,841 to 130,066.
The patents were downloaded and brought under the control of relational database management using dedicated software routines. Table 1 provides the descriptive statistics.
|
|
N |
N / patent |
|
|
patents |
138,751 |
|
|
|
inventors |
365,699 |
2.63 |
|
|
applicants |
473,367 |
3.41 |
|
|
classifications |
325,393 |
2.35 |
|
|
designations |
13,847,717 |
99.80 |
} 102.8 |
|
regional |
415,729 |
3.0 |
|
|
countries |
225 |
includes regions |
|
Table 1: descriptive statistics of the data
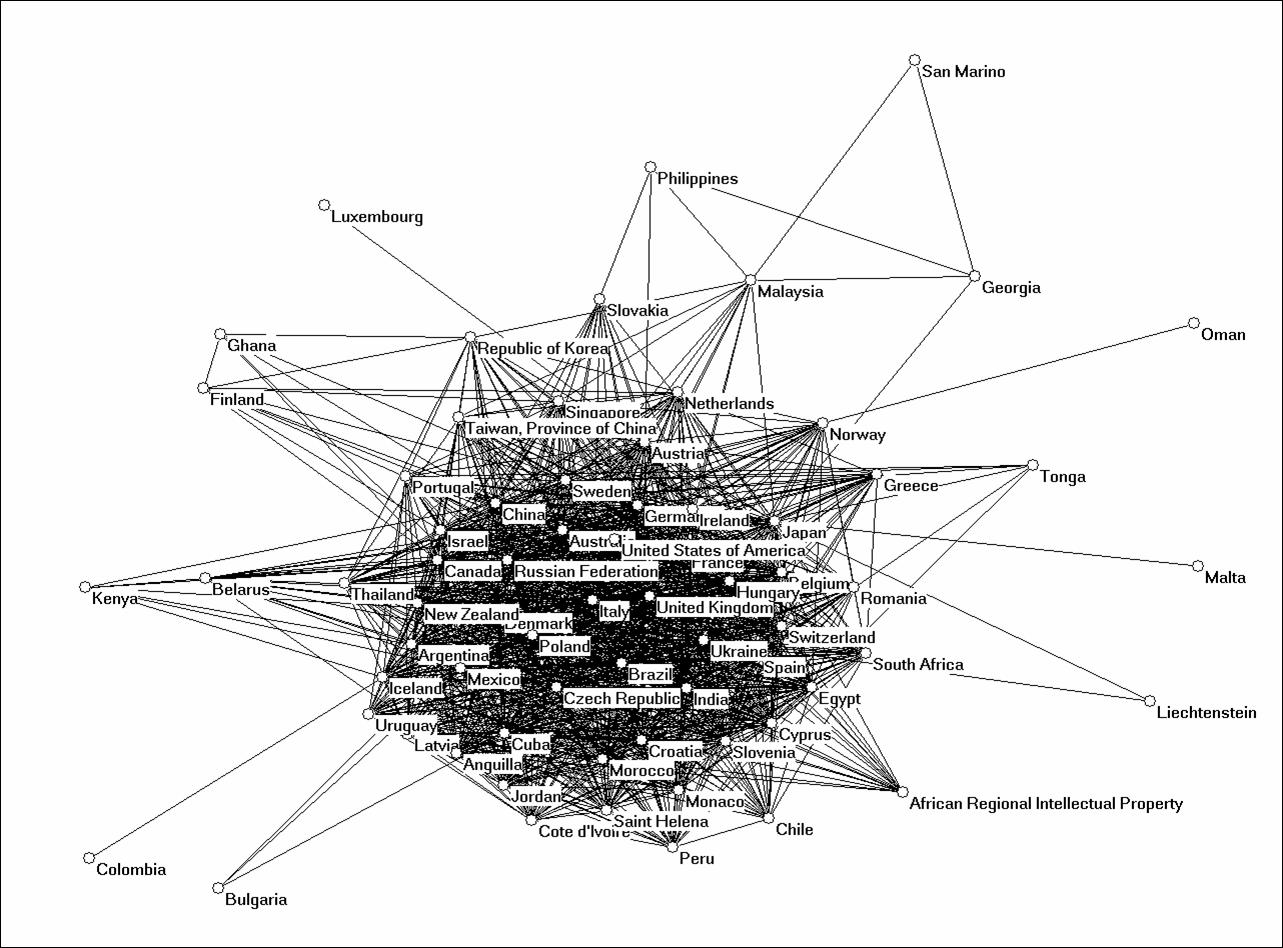
Using the addresses of the inventors for the attributions, the distributions of inventors and applicants over various countries are shown in Figure 2. These distributions exhibit the well-known logarithmic shape of a Lotka-distribution. The fit is almost perfect (r > 0.99) for the inventors.
Figure 2: Distribution over major patenting countries (N patents > 1000)
Relatively small countries like Korea and the Netherlands are more important contributors to the database than Italy and China. In larger countries, domestic patenting may play a more important role than in smaller ones. Within the EU, European patents increasingly replace domestic patenting. For example, only 2,152 of the 17,095 patents with a German inventor are patented in Germany itself. Note that Russia is not a major player in this system.
As summarized in Table 1, each patent has on average 2.6 inventors and 3.4 applicants. However, 334,737 inventors (> 99%) are also co-applicants; only 138,630 applicants are non-inventors. This is approximately one per patent. Figure 2 shows that the practices of co-application by inventors vary among countries. In the case of South Korea, for example, mostly inventors seem to apply.
The number of classifications per patent is on average 2.4. The number of designations is of the order of 100. Further analysis of these co-designations may be interesting from the perspective of industrial strategies and spillovers. As noted, the classifications are very detailed, using up to 12 digits. The main classes are contained in a four-“digit” categorization (WIPO, 2006). Table 2 provides class A01 and its four-digit extensions as an example. In the 2006 data, 121 main categories (at the three-digit level) were included with elaboration into 623 categories at the four-digit level.
|
A01 |
AGRICULTURE; FORESTRY; ANIMAL HUSBANDRY; HUNTING; TRAPPING; FISHING |
|
A01B |
Soil working in agriculture or forestry; Parts, details, or accessories... |
|
A01C |
Planting; Sowing; Fertilising |
|
A01D |
Harvesting; Mowing |
|
A01F |
Processing of harvested produce; Hay or straw presses; Devices for... |
|
A01G |
Horticulture; Cultivation of vegetables, flowers, rice, fruit, vines,... |
|
A01H |
New plants or processes for obtaining them; Plant reproduction by... |
|
A01J |
Manufacture of dairy products |
|
A01K |
Animal husbandry; Care of birds, fishes, insects; Fishing; Rearing or... |
|
A01L |
Shoeing of animals |
|
A01M |
Catching, trapping or scaring of animals; Apparatus for the destruction... |
|
A01N |
Preservation of bodies of humans or animals or plants or parts thereof;... |
Table 2: The first category (“A01”) of the IPC with its sub-classifications
as an example
From the perspective of visualization, the 121 categories at the three-digit level are optimal, since the screen becomes unreadable with larger numbers. The user could then be enabled to zoom into the four-digit level. However, in such a hierarchical approach one would lose the lateral links provided by the co-classification analysis. In this study, I first focus on the network of co-classifications at the three-digit level and subsequently at the four-digit level, and then analyze the level of detail available at the level of the nations participating in the database. The analytical insights may help us to understand which approach is more feasible and meaningful.
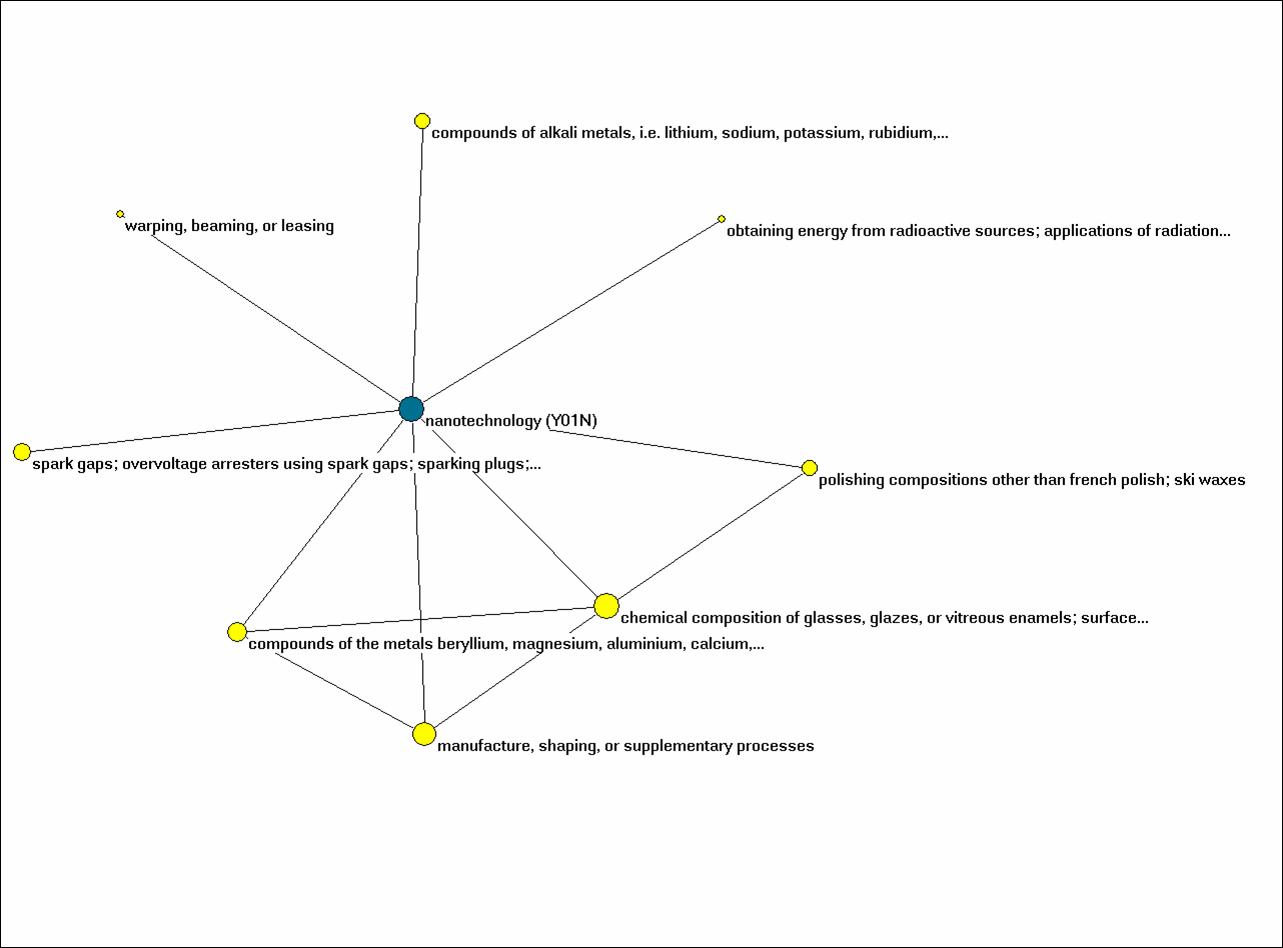
One four-digit category was added to the patents by hand, using the search facility of the European Patent Office at http://ep.espacenet.com/advancedSearch?locale=en_EP. The EPO recently made a substantial investment by developing the code “Y01N” as an additional tag to the existing database for the nano-categories (Scheu et al., 2006; Hullmann, 2006).[1] The tag is relevant because of the interest in policy circles in the evaluation of the current efforts to stimulate nanotechnology (Braun & Meyer, 2007). Since the EPO database can also be searched for PCT applications, 762 records could be matched with this tag.[2] Thus, at the four-digit level, I work with 624 categories.
4.2. Methods
Both at the three-digit and the four-digit level, a matrix was constructed with the patents as the units of analysis and the classification codes as column variables. The analysis focuses on the relations among the variables. For that purpose, I use factor analysis (Varimax Rotation in SPSS) and visualization techniques from social network analysis after normalization of the variables using the cosine. The factor analysis informs us about the structure in the matrix, while the cosine-normalized matrices allow for the visualization and the study of centrality measures (Leydesdorff, 2007). Whenever a submatrix is extracted—for example, for a country on the criterion of the institutional address of the inventor—these same analytical techniques are used.
Of the 138,751 patents, only 135,536 patents contained valid classifications. As noted, the number of classifications in this data was 121 and 624 at the level of three and four digits, respectively. From these matrices, subsets were extracted for 126 countries. Additionally, an aggregated file of countries versus classification codes was generated for further analysis. The latter file enables us to study the distributions of classifications over countries or, vice versa, the distributions of countries over classifications. For example, one can raise the question how patents with the IPC-classification “B82B: Nano-structures: Manufacture and treatment thereof” or the ECLA-tag for nanotechnology “Y01N” are distributed across the countries.
The two basic matrices of patents versus classification codes are extremely sparse: in the case of three-digit classes only 1.14% of the cells have a non-zero value and in the four-digit case only 0.25%. Because of the large numbers of zeros the cosine between the variable vectors is a better measure of similarity than the Pearson correlation coefficient (Ahlgren et al., 2003). Unlike the latter, the cosine normalizes with reference not to the arithmetic mean, but to the geometric mean. Using the cosine values, one can span a vector space which can be used for visualization purposes (Salton & McGill, 1983; Breschi et al., 2003).
The freeware program Pajek (available for academic purposes at http://vlado.fmf.uni-lj.si/pub/networks/pajek/) is used for the visualizations of the cosine-normalized patterns; UCINet and SPSS are used for the statistical analysis. For each country, a cosine-normalized input-file for Pajek is brought online at http://www.leydesdorff.net/wipo06/index.htm. These files allow users to freely choose a visualization routine for a specific country, since Pajek files can be exported into other formats. I provide examples below using the available visualization routines with the purpose of conveying the analytical argument. The algorithm of Furchterman & Reingold (1991) is used in this version for most of the visualizations because—unlike using Kamada & Kawai (1989)—the isolates remain meaningfully visible using this algorithm.
Within the visualizations, the size of the nodes is set proportionally to the logarithm of the number of patents in the category. The lines are made proportional to the cosine values in five equal steps of 0.2. A threshold is set at the cosine ≥ 0.05 in order to weed out incidental variation. In most cases, greyshades are added using the k-core algorithm for the partitioning in order to support the readability of the visualizations.
5. Results
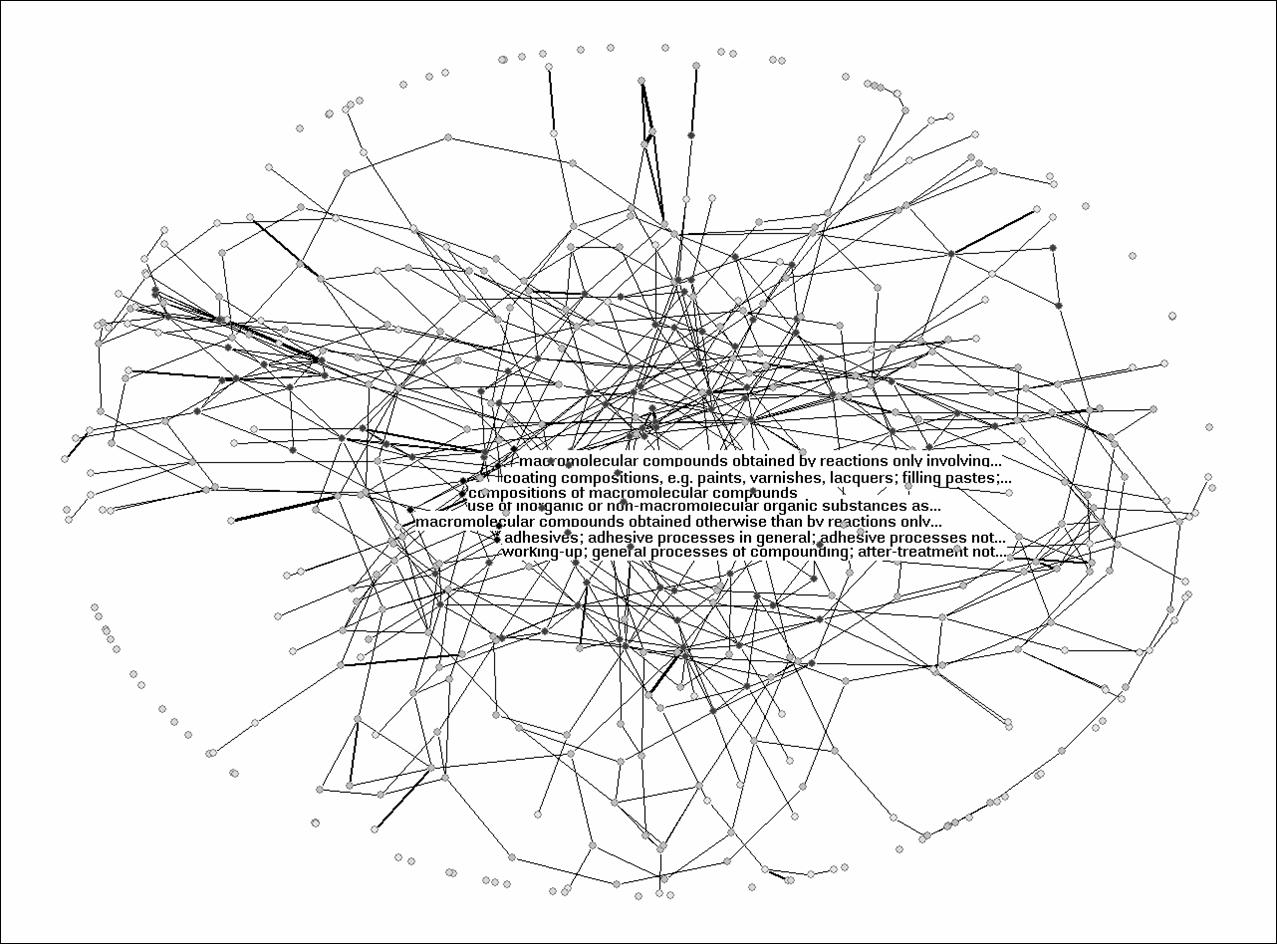
Let us first inspect the overall picture for the 121 patent classifications at the three-digit level and the 135,536 patents. Figure 3 shows that the set is not well connected. Fifty-six of the 121 categories are not connected to others at the level of cosine ≥ 0.05; only 13 are more strongly connected (as k-cores); 52 classes are connected in weak graphs. I added labels to the 13 categories which form more strongly connected k-cores. Upon visual inspection, it seems that the well-connected sets represent chemical industries and biotechnological applications in agriculture.
Figure 3: 121 patent classifications at the 3-digit level; N = 135,536; cosine ≥ 0.05; 2D-visualization based on the algorithm of Fruchterman & Reingold (1991).
In other words, the co-classifications do not reveal a clear structure. Unlike scientific citations, one would not expect to find the operation in this data of structure-generating mechanisms like the Matthew effect (Merton, 1968) or preferential attachment (Barabási, 2002; cf. Leydesdorff & Bensman, 2006). On the contrary, one would expect the index to enable the patent offices to distribute the patents over categories. The number of patents per class is intentionally kept down, but a new subclass can be formed to accommodate overflow (Larkey, 1999). Notice also that in the analysis, all PCT applications are considered for a certain time period; this would equal to an analysis of all scientific publications for a given time period. Would one observe a lot of structure within such an exercise?
A next question is whether countries show specific profiles within the larger set. I explore this below using Germany and China as examples. Germany is one of the largest share-holders in the PCT applications, while China is at the ninth position (Figure 2). Germany, of course, has a mature industrial structure, while the Chinese system has been booming during the last decade or so. The German patent set of 17,095 patents covers all 121 patent categories (Figure 4); the Chinese one based on 3,084 patents contains 109 of these categories (Figure 5). Table 3 compares the two sets with the global sets in terms of network statistics.
|
three digits; cosine > 0.05 |
Global set (N = 121) |
Germany (N = 121) |
China (N = 109) |
|
Density |
0.008 |
0.008 |
0.020 |
|
% Degree centralization |
4.31 |
2.56 |
9.33 |
|
% Closeness centralization[3] |
n.a. |
n.a. |
n.a. |
|
% Betweenness centralization |
0.78 |
0.90 |
21.28 |
|
Clustering coefficient |
0.198 |
0.089 |
0.233 |
Table 3: Network statistics of the cosine-normalized matrices for the
German, Chinese, and global sets of patents classified at the three-digit level.
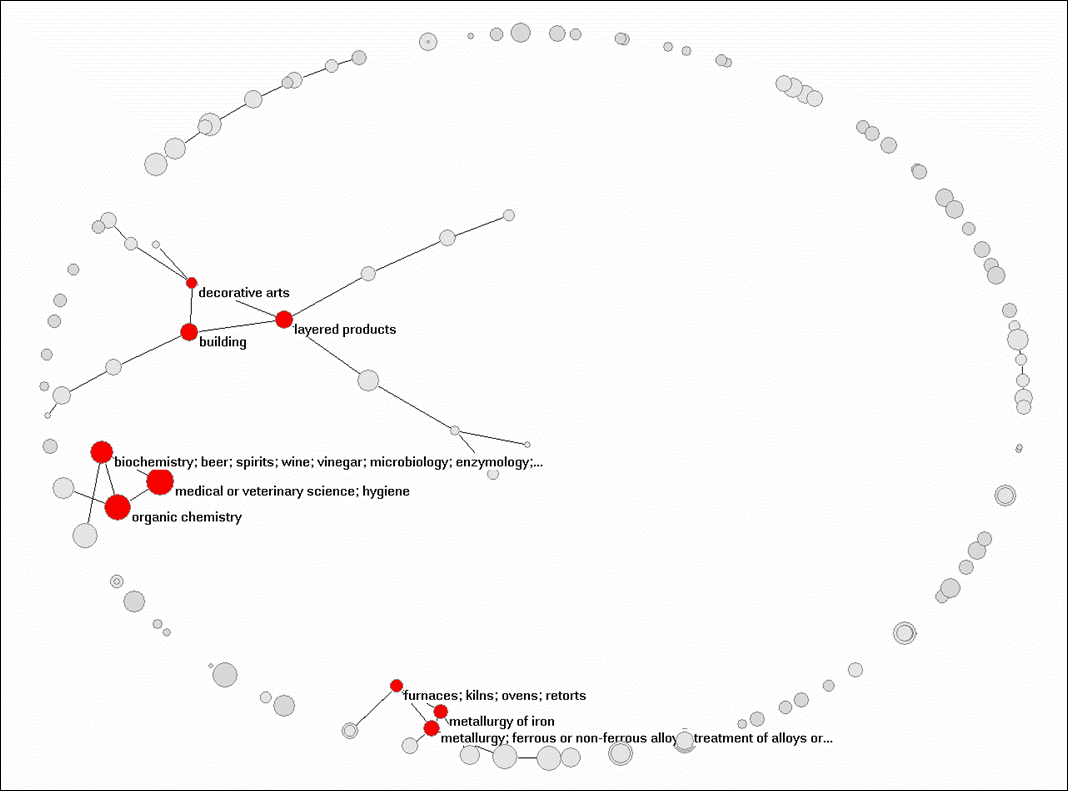
Figure 4: Co-classifications of 17,095 of German patents at the 3-digit level; cosine ≥ 0.05; 2D-visualization based on the algorithm of Fruchterman & Reingold (1991).
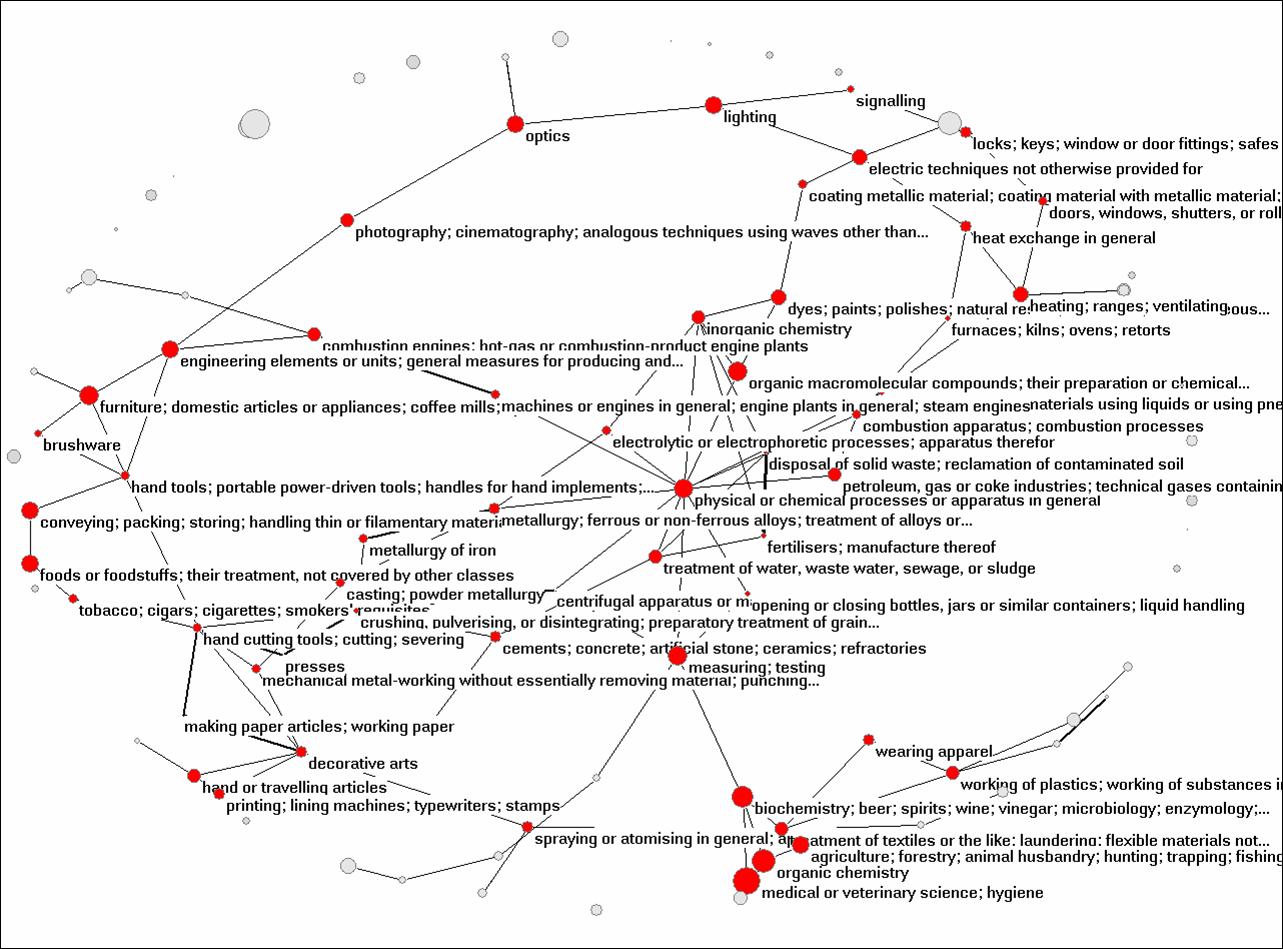
Figure 5: Co-classifications of 3,084 Chinese patents at the 3-digit level; cosine ≥ 0.05; 2D-visualization based on the algorithm of Fruchterman & Reingold (1991).
The structure in the German set is of the same order as for the complete set, while there is much more structure in the Chinese set. In Figure 5, 82 of the 109 classifications are connected into a weak component. All three sets (the global one and the two for Germany and China, respectively) have in common a core group of “medical or veterinary science; hygiene,” biochemistry, and organic chemistry.
Factor analysis of the underlying matrices of patents versus classes confirms that there are no pronounced eigenvectors: more than 55 eigenvectors explain more than an average variable; none of the eigenvectors explains more than 2% of the common variance (Leydesdorff & Hellsten, 2005). The Chinese network is a bit more pronounced than the German one or the one at the global level.[4] In other words, the networks are very flat and the categories are not obviously informative.
The lack of organization in the data suggests taking a closer look at betweenness centrality as another measure for connectedness and coherence in the profiles (Freeman, 1997; Breschi et al., 2003; Leydesdorff, 2007). Table 4 provides the top-25 categories in terms of the percentage of betweenness centrality for the two countries.[5]
|
% |
China |
% |
|
|
1. medical or veterinary science; hygiene |
7.5 |
1. measuring; testing |
13.2 |
|
2. engineering elements or units; general measures for producing and... |
6.9 |
2. medical or veterinary science; hygiene |
13.1 |
|
3. measuring; testing |
6.8 |
3. furniture; domestic articles or appliances; coffee mills; spice mills;... |
10.1 |
|
4. physical or chemical processes or apparatus in general |
5.9 |
4. physical or chemical processes or apparatus in general |
8.9 |
|
5. vehicles in general |
5.8 |
5. basic electric elements |
8.5 |
|
6. dyes; paints; polishes; natural resins; adhesives; miscellaneous... |
3.5 |
6. engineering elements or units; general measures for producing and... |
7.9 |
|
7. working of plastics; working of substances in a plastic state in general |
3.5 |
7. organic macromolecular compounds; their preparation or chemical... |
5.7 |
|
8. basic electric elements |
3.3 |
8. computing; calculating; counting |
5.4 |
|
9. furniture; domestic articles or appliances; coffee mills; spice mills;... |
2.7 |
9. layered products |
4.8 |
|
10. layered products |
2.6 |
10. vehicles in general |
4.6 |
|
11. conveying; packing; storing; handling thin or filamentary material |
2.5 |
11. foods or foodstuffs; their treatment, not covered by other classes |
3.8 |
|
12. organic macromolecular compounds; their preparation or chemical... |
2.3 |
12. conveying; packing; storing; handling thin or filamentary material |
3.8 |
|
13. machine tools; metal-working not otherwise provided for |
1.7 |
13. agriculture; forestry; animal husbandry; hunting; trapping; fishing |
3.0 |
|
14. ammunition; blasting |
1.7 |
14. cements; concrete; artificial stone; ceramics; refractories |
2.7 |
|
15. coating metallic material; coating material with metallic material;... |
1.6 |
15. treatment of textiles or the like; laundering; flexible materials not... |
2.7 |
|
16. electric techniques not otherwise provided for |
1.5 |
16. electric techniques not otherwise provided for |
2.7 |
|
17. building |
1.3 |
17. electric communication technique |
2.4 |
|
18. agriculture; forestry; animal husbandry; hunting; trapping; fishing |
1.3 |
18. dyes; paints; polishes; natural resins; adhesives; miscellaneous... |
2.3 |
|
19. spraying or atomising in general; applying liquids or other fluent... |
1.2 |
19. hand cutting tools; cutting; severing |
2.3 |
|
20. optics |
1.1 |
20. optics |
2.2 |
Table 4: top 20 classes at the three-digit level and the percentages of betweenness centrality for Germany and China, respectively.
These results confirm the impression that the Chinese system is more integrated than the German one in terms of these measures. Although one can observe differences in the ranking, these differences are not obviously informative. The similarities are also considerable: the two tables have fourteen of the twenty categories in common.
5.2 The 4-digit level
At the 4-digit level, the lack of structure is less obvious, but still considerable at the level of the aggregated set. 115 categories are not connected at the 0.05 level for the cosine. There are a few dense clusters in traditional industries (fertilizers, chemistry, etc.).
Figure 6: 624 patent categories versus 135,536 patents; 115 classes are not connected at cosine ≥ 0.05; visualization based on the algorithm of Fruchterman & Reingold (1991).
At this level of fine-tuning, the German set appears as more integrated than the Chinese one. 560 of the 624 categories are used by the German set, as against 412 by the Chinese set; and 501 of the categories are related with a threshold of cosine ≥ 0.05 as against 349 in the Chinese case. However, in terms of structural properties, the two matrices (and the one for the global set) are again very flat. In the German case, for example, the first factor explains 0.32% of the common variance with an eigenvalue of 1.988, and 284 factors have an eigenvalue larger than one. Table 5 provides the network statistics in a format similar to that of Table 3 above.
|
four digits; cosine > 0.05 |
Global set (N = 624) |
Germany (N = 560) |
China (N = 412) |
|
Density |
0.003 |
0.005 |
0.007 |
|
% Degree centralization |
1.43 |
1.83 |
4.18 |
|
% Closeness centralization |
n.a. |
n.a. |
n.a. |
|
% Betweenness centralization |
10.20 |
8.76 |
9.74 |
|
Clustering coefficient |
0.345 |
0.215 |
0.356 |
Table 5: Network statistics of the cosine-normalized matrices for the German, Chinese, and global sets of patents classified at the four-digit level.